ENAUSDT.P – Long from Discount After Liquidity SweepENA swept sell-side liquidity into the PDL zone and reacted strongly from higher timeframe demand.
Price is now reclaiming internal structure and trading around the equilibrium of the current range. I’m positioning long, anticipating a move back toward premium liquidity.
🔹 Entry: 0.114–0.116
🔹 Stop: 0.1059 (structure invalidation)
🔹 Targets:
– 0.127
– 0.131–0.133
– 0.143
– 0.1576 (extended)
This is a liquidity-based long, not a trend reversal call. If price fails to hold above the reclaimed structure and breaks below 0.1059, the thesis is invalid.
Risk managed, 3–5x leverage only.
What traders are saying

ENA: is this the moment to buy? key levels and targets aheadENA. Thinking this thing is dead, or is the crowd just giving up at the worst moment? According to industry sources, yield and restaking tokens have been under pressure again after fresh headlines about tighter oversight and cooling demand, and ENA has been sold with the rest of the basket. On the 4H chart we’re now sitting right on a big demand zone around 0.10 where price previously bounced.
Technically, trend is still heavy, but RSI is hugging the oversold area and each new low comes on slightly weaker volume, which often precedes a relief squeeze. I’m watching for a short‑term bounce toward the nearest volume pocket around 0.118‑0.13, where the last consolidation and volume cluster sit. I might be wrong, but this looks more like late capitulation than the start of a fresh leg down. ✅
My base plan: I only like longs while 0.10 holds as support, with invalidation just below that zone and partial targets near 0.118, 0.125 and 0.13. If 0.10 gives way and we start accepting below, I’ll drop the long idea and expect continuation to lower liquidity zones, where I’ll re‑evaluate for the next setup. For now I’m flat and waiting for either a clear bounce signal from this support or a clean breakdown.

#ENA/USDT setting up for its next leg higher.#ENA
The price is moving within a descending channel on the hourly timeframe. It has reached the lower boundary and is heading towards a breakout, with a retest of the upper boundary expected.
The Relative Strength Index (RSI) is showing a downward trend, approaching the lower boundary, and an upward bounce is anticipated.
There is a key support zone in green at 0.1070. The price has bounced from this level several times and is expected to bounce again.
The RSI is showing a trend towards consolidation above the 100-period moving average, which we are approaching, supporting the upward move.
Entry Price: 0.1168
Target 1: 0.1200
Target 2: 0.1260
Target 3: 0.1325
Stop Loss: Below the green support zone.
Remember this simple thing: Money management.
For any questions, please leave a comment.
Thank you.

#ENA #Crypto #Altcoins #TechnicalAnalysis #SwingTrade #BinanceENA/USDT – Weekly Timeframe | Positioned at Major Demand
ENA is currently trading at a critical weekly demand zone, aligning with previous structural support. Price action suggests the asset is approaching a potential exhaustion phase following a prolonged corrective cycle.
Current Price: 0.12 USDT
Market Structure: Macro downtrend, testing historical support
Location: High-probability accumulation zone
⸻
Technical Outlook
The current weekly structure shows compression near a key support base (Support Zone 1 & 2). Historically, such zones have acted as strong reaction points.
If buyers step in and a bullish weekly confirmation (engulfing / market structure shift) occurs, upside expansion becomes likely.
Upside Targets:
• Resistance Zone 1: ~0.80 USDT
• Resistance Zone 2: ~1.20 USDT
A successful reclaim of Resistance Zone 1 would signal structural strength and open the path toward higher liquidity levels.
⸻
Risk Scenario
A decisive weekly close below the major support zone would invalidate the bullish thesis and expose price to further downside continuation.
Proper risk management and confirmation-based entries are advised.
⸻
Strategic Approach
• Monitor for weekly bullish confirmation
• Consider phased accumulation within demand
• Invalidate below major structural support
⸻
Conclusion:
ENA is trading at a technically significant level where asymmetric risk-to-reward may develop, provided buyers defend the current demand zone.

Weekly Down-Channel: Support Rebound Play ?ENA/USDT is trading at the lower boundary of a well-respected weekly descending channel. This area acts as dynamic support, so the primary idea is a controlled rebound toward the channel midline first, and potentially the upper boundary if momentum follows. Confirmation comes from strong rejection wicks and a weekly close holding the channel support (plus a break of minor bearish structure on lower TFs). A clean weekly close below the lower band invalidates the bounce and favors bearish continuation.

ENA / USDT — Daily Update (Follow-up)Price kept respecting the bearish structure after the previous update.
The rejection at the trendline confirmed sellers are still in control and the market moved back into the lower range.
Current situation
Local support: 0.095 – 0.115
Mid level to reclaim: 0.131
Key S/R flip: ~0.20
Still trading below descending trendline → bearish pressure remains
What this means
Holding below 0.131 keeps the chart weak → continuation range / grind down likely.
A reclaim of 0.131 opens room for a relief move into 0.20 S/R flip area.
Only above 0.20 the structure actually starts improving.
Simple plan
Below 0.131 → bearish / ranging
Reclaim 0.131 → bounce potential
Reclaim 0.20 → trend shift signal
Market now deciding between accumulation at lows or continuation.
MrC

ENA / USDT – Daily OutlookENA remains in a bearish higher timeframe structure, continuing to respect the descending daily trendline.
Price is still forming lower highs and lower lows, indicating no confirmed trend reversal.
The previous daily support has been cleanly broken and is now acting as resistance.
Market Structure
HTF structure remains bearish
No daily MSS to the upside
Current price action is corrective within a downtrend
Key Observations
October downside wick has been fully filled
Price is trading back inside the lower range
The 50% retracement aligns perfectly with the broken support
This level now acts as a clear S/R flip
Trend Context
Price remains below the daily descending trendline
No daily close above resistance
No acceptance above reclaimed structure
Key Levels
HTF Resistance / 50% Retracement: 0.18 – 0.19
Trendline Reclaim: ~0.25
HTF Support: ~0.12
Invalidation: Daily close above trendline + reclaimed support
Bias
HTF Bias: Bearish
Expectation: Corrective moves only until structure shifts
As long as price remains below the trendline and reclaimed resistance, upside moves are considered corrective.
Will ENA manage to reclaim structure, or is this just another lower high?
MrC

Is $ENA Ready for a Bullish Move?BINANCE:ENAUSDT is retracing into a well-defined demand zone at $0.1667–$0.1652, where price previously formed higher lows and showed strong buyer absorption. The recent impulsive move confirms demand-side strength, keeping market structure bullish and favoring continuation toward liquidity highs.
🎯 Entry Zone: $0.1667 – $0.1665
🛑 Stop Loss: $0.1645
🏹 Target 1: $0.1730
🏹 Target 2: $0.1800
🏹 Final Target: $0.1865
Ethena has partnered with Safe, a popular self-custody wallet used by big crypto teams. This deal reduces gas fees and boosts rewards for people holding USDe, Ethena’s dollar-pegged token.
More users + cheaper transactions + better rewards = stronger demand for Ethena, which supports the bullish price setup on the chart.

ENA / USDT: Reclaiming the Floor or Further Capitulation?Market Context
ENA has recently undergone a sharp correction after being rejected from the Daily Order Block (D OB) located between 0.2400 and 0.2600. The price has now dropped below its previous swing low (marked by the dashed pink line) and is currently hovering near 0.1746, searching for a new bottom.
Key Technical Factors
Daily Order Block (Supply): The orange-shaded area represents a massive supply zone where 2.873B (29%) of the volume profile value area is concentrated. This remains the primary long-term resistance.
Point of Control (POC): The solid red horizontal line at ~0.2110 marks the high-volume node. This will be the first major obstacle for any relief rally.
Support Breach: The price has broken below the previous liquidity level at ~0.1900, turning former support into potential resistance.
Volume Profile Gap: Notice the "thin" volume profile bars below the current price. This indicates that if 0.1700 fails to hold, the price could drop quickly as there is little historical "buy-side" support in that range.
Trading Scenarios
1. The Bearish Continuation (High Probability)
If the daily candle fails to reclaim 0.1800, expect a further slide toward the next psychological support levels at 0.1600 or lower. The trend remains firmly bearish as long as the price stays below the POC.
2. The Relief Rally (Mean Reversion)
If we see a "fake-out" (wick) below current levels followed by a strong close back above 0.1850, we may see a rally back to the POC (0.2110). Traders would look for a "Double Bottom" formation here before considering a long position.
Key Levels to Watch
Immediate Resistance: 0.1900 (Old Support)
Major Resistance: 0.2110 (POC)
Critical Support: 0.1700

#ENA/USDT setting up for its next leg higher.#ENA
The price is moving within a descending channel on the hourly timeframe. It has reached the lower boundary and is heading towards a breakout, with a retest of the upper boundary expected.
The Relative Strength Index (RSI) is showing a downward trend, approaching the lower boundary, and an upward bounce is anticipated.
There is a key support zone in green at 0.2130. The price has bounced from this level several times and is expected to bounce again.
The RSI is showing a trend towards consolidation above the 100-period moving average, which we are approaching, supporting the upward move.
Entry Price: 0.2172
Target 1: 0.2200
Target 2: 0.2254
Target 3: 0.2322
Stop Loss: Below the green support zone.
Remember this simple thing: Money management.
For any questions, please leave a comment.
Thank you.

$ENA looks like it’s trying to base !!MIL:ENA looks like it’s trying to base 👀
ENA has been in a clear downtrend, but price is now holding a key support zone around $0.19–$0.21, right at the lower trendline. Selling pressure is slowing and structure is starting to compress.
The main level to watch is the descending trendline / 200 MA zone around $0.24–$0.26.
A clean break and hold above this area could signal a trend shift, opening the door for a move toward $0.30+.
Until then, this remains a high-risk area, but a breakout would be the confirmation.

ENA 1D SHORT SETUP 16/01My personal Long/Short Score: 36 (mixed, short-leaning)
Panel context:
- Narrative: global + local = SHORT
- Macro: flat / risk-sensitive tape → trade only, no “investment holds”
- Unlocks: strong unlock pressure (downside supply risk)
- Phase/EMA: mixed/chaotic EMA order, but multi-TF bars mostly below EMA → weak trend
- PA: volatility compression / transition to range → wait for reaction, not market chase
- Liquidity: “hunt up” (short squeeze risk) → confirmation first
- Key levels: Entry ~0.23 | SL 0.2538 | TP 0.1966 → 0.18 → 0.15
Data from my indicators:

ENA: entry point.Factors for Entering a Long Position
1. We enter at the PoC level.
2. Long FVG.
3. The price returns to the range where we have the PoC level and the long FVG. I expect the price to react from this level up to the upper limit of the range.
BINANCE:ENAUSDT.P

EnausdtRetesting the lower accumulation zone and holding.
The ema's are significantly higher than this zone and the price has been retesting these periodically.
This app had one of the highest revenues apart from perp dex's in the entirety of crypto and one of the only new significant stable coin technologies/ functions to arise since crv, farming perp funding rates with a robust delta neutral strategy and run like a dao.
Given its significant technolocial placing as a first mover on a new concept in a budding market id expect there to be large players accumulating this project at these levels and the price action is acting as such.
The cyclic target is ~99% higher than the current price.
Very good risk return given the high pribability of this being a local low.
That being said i expect the price to retest the ema and reject into march with the rest of the market, without the 99% target being reached.
I'd expect a rejection off the red ema level with around 50% higher price target.

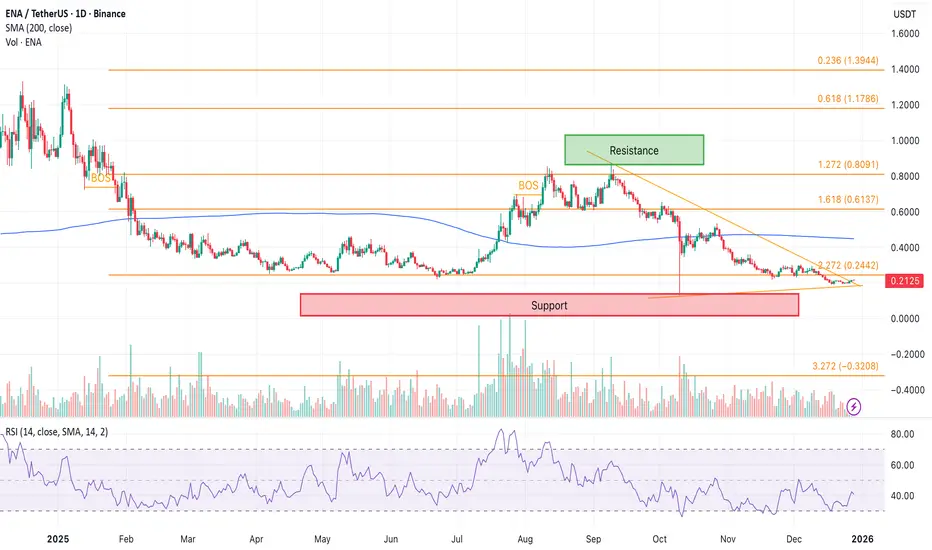
ENAUSDT at Critical Trendline — Breakdown or Reversal Ahead?ENA/USDT on the Daily (1D) timeframe remains in a primary bearish phase since topping near the 0.87 area. Market structure continues to print lower highs and lower lows, confirming strong seller dominance. Price is currently attempting a bullish pullback and is testing a descending trendline resistance.
---
Pattern Explanation
The dominant pattern visible is a Descending Trendline (Bearish Continuation Structure).
Pattern characteristics:
A descending trendline connecting lower highs since September.
Multiple price rejections from this trendline.
The current pullback remains below dynamic resistance, with no confirmed breakout.
This pattern typically indicates:
As long as the trendline holds, bearish control remains intact.
Rejection from the trendline often leads to further downside continuation.
---
Key Levels
Resistance Levels:
0.2575 → current rejection zone (trendline + minor resistance)
0.3000
0.3400
0.5100 (major resistance)
0.6100 – 0.8150 (upper supply zone)
Support Levels:
0.2328 → nearest support
0.2000 → psychological support
0.1750 → last demand zone (high-risk area)
---
Bullish Scenario
The bullish scenario becomes valid only after a confirmed breakout.
Bullish confirmation:
Daily close above the descending trendline
Increased volume during breakout
Successful retest of the trendline as support
Upside targets:
0.3000
0.3400
0.5100
Bullish conclusion: If ENA manages to break and hold above the trendline, bearish pressure weakens and a medium-term trend reversal becomes possible.
---
Bearish Scenario
The bearish scenario remains the primary outlook.
Bearish confirmation:
Strong rejection at the descending trendline
Failure to close above 0.2575
Formation of bearish continuation candles
Downside targets:
0.2328
0.2000
0.1750
Bearish conclusion: As long as price remains below the descending trendline, any upward move is likely just a pullback before further downside.
---
Conclusion
ENAUSDT remains in a strong bearish structure. The descending trendline is a key decision zone. Traders should wait for:
A clear breakout for bullish confirmation, or
A strong rejection for bearish continuation
Patience and confirmation are crucial as the market remains in a distribution phase.
---
#ENAUSDT #ENA #CryptoAnalysis #BearishTrend #DescendingTrendline #AltcoinAnalysis
#SupportResistance #PriceAction #DailyChart
#CryptoTrading #TechnicalAnalysis

ENA Holding Demand While Pressing Descending ResistanceENA remains in a broader downtrend but is currently stabilizing above a well defined demand zone around 0.21–0.23. Price is compressing into the descending resistance trendline after forming higher lows from this support area.
A sustained hold above 0.21 keeps the short term structure constructive. A clean breakout and acceptance above the descending trendline can trigger a recovery toward 0.30, followed by higher resistance levels at 0.36 and 0.42.
Failure to hold the 0.21 demand would invalidate the bounce structure and expose downside toward the lower range support near 0.19.

ENA/USDT Holds Key Demand — Pullback Looks Like a Reload.BINANCE:ENAUSDT has retraced cleanly into a well-defined demand zone ($0.242–$0.239), where buyers previously stepped in aggressively. This looks like a healthy reset after the impulsive push up, not a trend reversal. As long as price holds above $0.2369, the bullish structure remains intact.
Bias: Bullish continuation
Entry Zone: $0.2423 – $0.2396
Targets: $0.2504 → $0.2609
Invalidation: Below $0.2369
Momentum favors a bounce if demand holds.

ENAUSDT 1D#ENA is on the verge of breaking above the descending resistance and the daily EMA50. Entry is recommended only after a solid breakout. If confirmed, the potential upside targets are:
🎯 $0.2751
🎯 $0.3269
🎯 $0.3689
🎯 $0.4108
🎯 $0.4705
🎯 $0.5465
⚠️ Always apply tight stop-losses and maintain strict risk management.

ENA – Daily UpdateFrom the higher timeframe, ENA is still trading within a broader bearish structure.
The recent bounce is a reaction from support, not a confirmed trend reversal yet.
On the Daily, price is still respecting the descending trendline.
At this moment, there is no valid long trigger.
What I want to see next:
Price needs to print a high and then reclaim the key resistance level, turning it into support.
That R/S flip is required to confirm a potential structure shift.
Until that reclaim happens, this remains a patience trade.
No reclaim, no confirmation = no trade.
Let price do the work first.
Are you waiting for the reclaim or staying sidelined for now?
MrC

EnaLooks good to be holding the range low here..
Id say that was local bottom
Chance of capitulation event all year basically... Just by the cyclic workings but most of the sell-off appears done..

Here’s Where Ethena (ENA) Price Could Go Next* Ethena has just emerged out of a bear flag, but whether it has legs to stand on or if further downside can be expected is now in question.
* The recent bounce has been a weak one, which shows a measure of restraint on the part of traders who are holding out for further signs.
* On-chain data points to stabilization, not strong buying, which keeps ENA in a wait-and-see phase for now.
When you zoom out and look at Ethena’s recent price action, it’s clear the market isn’t panicking anymore, even after a sharp breakdown.
The ENA price didn’t drift lower slowly. Once the bear flag broke, the price dropped fast, falling more than 30% in a short span. That move wiped out late buyers and cooled off the optimism that had built up during consolidation. Since then, though, the tone has shifted. Instead of continuing lower, the market looks like it’s taking a pause.
Over the past few sessions, the ENA price has been hovering around the $0.2000–$0.2100 area. This is the first zone where selling pressure has clearly slowed after the breakdown.
The price isn’t cascading lower anymore, and dips into this range are getting absorbed more quickly. That indicates sellers are losing urgency, even if buyers aren’t stepping in aggressively yet.
That matters. After slicing through multiple support levels during the selloff, this is the first place where the market seems willing to stabilize instead of accelerate lower. It doesn’t mean a bottom is in, but it does suggest the market is digesting the move rather than reacting emotionally.
On-chain data supports that view. ENA’s market cap stopped falling sharply once the price reached this area and has moved mostly sideways since. Capital isn’t rushing out anymore, even if fresh inflows haven’t arrived.
What’s next for Ethena?
The main challenge remains overhead resistance. The ENA price continues to stall near $0.2160 on the daily chart.
Every bounce so far has failed before reclaiming that level, keeping the broader trend intact. Until that zone is cleared and held, upside moves are better seen as relief bounces, not true reversals.
For now, ENA remains in wait-and-see mode. The damage has already been done, and what the market needs next isn’t hope, but confirmation.
ENA/USDT at a Critical Demand Zone – Bounce or Breakdown Ahead?ENA/USDT is currently in a strong bearish phase on the 3D timeframe. After failing to hold the distribution area above 0.80, price experienced a sharp and sustained decline, returning to a highly significant historical demand zone. The yellow zone at 0.212 – 0.190 is a critical area that will determine the next major move.
---
Market Structure & Price Action
Overall structure remains Lower High – Lower Low (bearish trend)
Strong breakdown from the 0.40 → 0.28 area confirms bearish continuation
Price is now testing a major multi-month demand zone
Market reaction here will define whether we see a technical rebound or further breakdown
---
Pattern Explanation
1. Descending Market Structure (Bearish Continuation)
Price has formed consistent lower highs since the 0.80 peak, showing dominant selling pressure.
2. Strong Demand Retest The 0.212 – 0.190 zone represents:
Previous accumulation area
Historical strong bounce level
Last major demand before potential deeper price discovery
3. Potential Dead Cat Bounce (if volume remains weak) A weak bounce without strong volume may only be a temporary pullback before continuation lower.
---
Key Levels
Support (Demand Zone):
0.212 – 0.190 (major demand / yellow zone)
Resistance (Supply Levels):
0.245
0.285
0.400
0.500
0.615
0.805
---
Bullish Scenario
The bullish scenario is valid only if price reacts strongly from the demand zone.
Conditions:
Price holds above 0.190
Clear rejection or bullish candle formation
Ideally supported by increasing volume
Potential upside targets:
0.245 (minor resistance)
0.285
0.400 (major resistance)
0.500 (extension target if momentum builds)
Note:
This bullish move would be considered a technical rebound, not a full trend reversal unless a higher-low structure is established.
---
Bearish Scenario
This scenario activates if the demand zone fails.
Conditions:
Daily / 3D candle close below 0.190
Lack of meaningful buying reaction
Downside risk:
Demand breakdown → bearish continuation
Potential capitulation phase
Lower prices become likely due to the absence of strong historical support below
---
Conclusion
ENA/USDT is currently at a critical decision zone.
A strong reaction from 0.212 – 0.190 could trigger a technical rebound
A confirmed breakdown would reinforce the broader bearish trend with deeper downside risk
Patience and confirmation are key due to elevated risk conditions.
---
#ENAUSDT #ENA #CryptoAnalysis #TechnicalAnalysis
#Altcoin #Binance #Downtrend #DemandZone
#SupportResistance #PriceAction

ENA / USDT – Short Bias (HTF + Confluence)ENA is currently trading below the weekly support level, which keeps the higher-timeframe bias bearish.
As long as price remains below this weekly level, longs are high risk.
On the 1H timeframe, price has retraced into a clear sell-side zone, aligning with:
Prior resistance
A clean bearish order block
Weak reaction on the retrace (no impulsive bullish displacement)
📉 Market context confirmation:
Total Market Cap still shows bearish structure, supporting downside continuation across altcoins.
Key thesis:
Weekly support flipt in to resistance
No bullish deviation confirmed
HTF + LTF structure align bearish
ENA only turns bullish if:
➡️ Price deviates below the level,
➡️ Reclaims the weekly level as support,
➡️ And shows strong bullish displacement (as discussed in the weekly analysis).
Until then, rallies are considered sell opportunities.
Target idea:
Liquidity draw towards equal lows (EQL) remains likely if resistance holds.
Not financial advice. Always manage risk.
Do you think ENA will reject from resistance or reclaim the weekly level first? 👀📉
MrC
