ATOMUSDT - A QUICK SELL SET UP - 09-02-2026ATOMUSDT - G-Money's short version analysis based purely on technical analysis only, no nonsense or "BS". I do totally ignore any fundamental analysis, technical analysis only
ATOMUSDT - still kinda on the "move" and continue DOWN...
Who did enter this trade earlier congratulations! Who missed it... See you next time! ;)
(TRY TO "EXPLORE" LTF ENTRY SET UPS, DON'T RUSH TO "JUMP IN", TAKE YOUR TIME...)
!!!!! BE AWARE: TESTING OF UNTESTED TECHNICAL ANALYSIS IN PROGRESS, BE AWARE OF "GLITCHES" !!!!!!
Chart is itself explaining. Kept a "KISS" approach all the way ( "Keep It Simple, Stupid") & beginners friendly... ;)
I do hope that nobody ignoring SL ( Stop Loss) ! Without it, It is a fastest way to loose hard earned money...
;)
Trade safe & don't do "gambling". In the end it never pays, not worth it to risk loose all your $...
PS: above technical analysis is done for the community & educational purpose only! It is not a financial advice. Just share my very own insight to it.
What traders are saying

Cosmos: ready for recovery? key levels and targets aheadCosmos. Tired of watching this thing bleed and finally show some life? Lately, according to market sources, Cosmos has been back in the news with talk about new app-chains and upgrades around shared security, and the market usually wakes up when that narrative returns. On top of that, majors are calming down, so side projects like this often get a bit of rotation.
On the 4H chart price ripped straight from the green demand area around 1.9 and is now slamming into the first big resistance box near 2.1-2.2 with RSI already in overbought. That tells me short-term fuel is getting low, even if the bigger picture bounce can continue. I might be wrong, but for me this zone is more "take profits and wait" than "ape in long".
My base case: a pullback into the 2.03-1.95 liquidity pocket, then another leg up toward 2.25 and maybe 2.35 ✅. I want to see buyers defend above the green demand; if 1.90 breaks convincingly, the door reopens to the lows around 1.80 ⚠️. Personally I'm waiting for that dip zone to build longs, not chasing green candles into resistance.

ATOMUSDT.P📊 ATOM/USDT Technical Analysis
Market Update:
The price action on ATOM/USDT is following our projected path perfectly. After a sweep of liquidity, the price reached our Invalidation Zone and faced a strong rejection.
Key Technical Levels:
Rejection Point: The price hit the QM (Quasimodo) and BPR (Balanced Price Range) levels before reversing.
Current Momentum: Bearish pressure is increasing after the failure to break the Invalid zone at 2.233.
Price Targets: Our primary target remains the sell-side liquidity at 2.023.
Execution Mindset:
"Discipline is choosing between what you want now and what you want most. Wait for the setup."


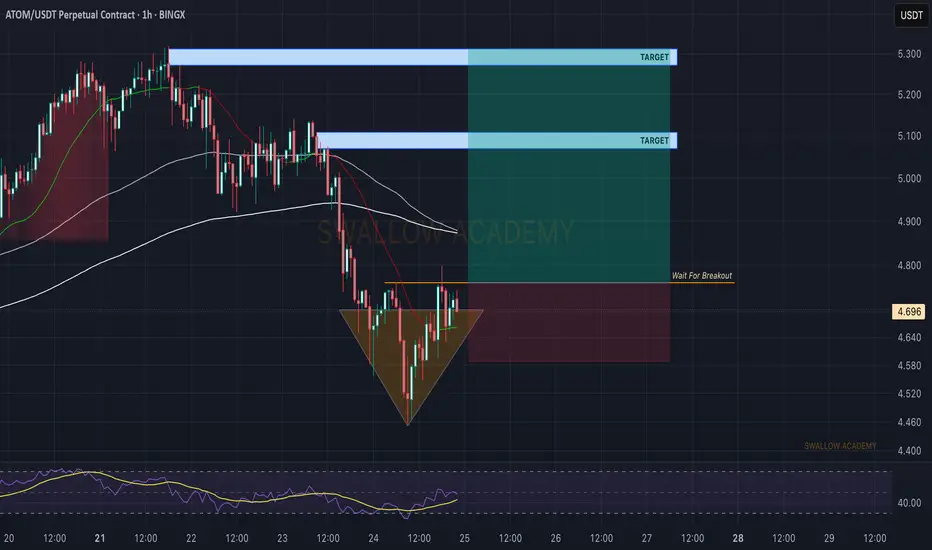
Cosmos (ATOM): Waiting Is Key | Potential Breakout IncomingCosmos might have a good buying opportunity soon, where we are looking for a proper MSB, which would confirm our bullish scenario for this setup here.
As soon as we get the MSB, we are going to look for a buying opportunity.
Swallow Academy
Cosmos (ATOM): Seeing Good Buying Opportunity | BULLISH AFCosmos is pushing strongly, giving us a sign of potential upward movement to happen anytime soon. So let's keep an eye on the 200 EMA and wait for a breakout from there.
More in-depth info is in the video—enjoy!
Swallow Academy

ATOMUSDT Weekly Supply Holds, Continuation Lower Still FavoredATOMUSDT remains structurally bearish after a prolonged distribution phase, with repeated rejections from major weekly supply zones at the $13–$17 and $40 regions confirming long-term seller dominance. Price has broken down from a compression structure near the $4.0–$3.5 immediate supply, accelerating into a new leg lower.
As long as ATOM trades below this flipped resistance, downside continuation toward the weekly demand at $1.30–$1.05 remains the primary scenario.
Any recovery from the lows should be treated as corrective unless price can reclaim and hold above the $3.50–$4.00 zone on a weekly closing basis.

Atom is bullish above the level atom is bullish if could manage to get out of the channel and above specified green level toward its tp

$ATOMUSDT QUICK ANALYSIS (1H)Cosmos ( BINANCE:ATOMUSDT ) is showing a bullish price setup on the 1-hour timeframe, supported by a clear Break of Structure (BOS) and strong demand-zone reaction.
According to the chart, ATOM price has retraced into a key demand zone between $1.949 and $1.941, an area where buyers previously stepped in aggressively.
As long as this zone holds, the bullish market structure remains intact. A potential long entry near $1.949 targets upside liquidity, with Target 1 at $2.026, aligning with the recent swing high, and Target 2 at $2.124, which coincides with a higher-timeframe supply zone and resistance area.
The stop loss at $1.924 sits below demand, protecting against structure invalidation.
Overall, this BINANCE:ATOMUSDT technical analysis suggests a favorable risk-to-reward bullish continuation, making Cosmos one of the stronger short-term crypto setups to watch.
⚠️ Entry Condition:
Look for bullish confirmation inside the DEMAND ZONE, such as a strong bullish candle close, rejection wick, or continuation pattern. If price breaks below the DEMAND ZONE, the bullish setup is invalid.

ATOM / USDT - A QUICK SELL SET UP - 29-01-2026ATOM-USDT G-Money's short version analysis based purely on technical analysis only, no nonsense or "BS". I do totally ignore any fundamental analysis, technical analysis only
ATOM / USDT still kinda on the "move" and continue DOWN...
Who did enter this trade earlier congratulations! Who missed it... See you next time! ;)
Chart is itself explaining. Kept a "KISS" approach all the way ( "Keep It Simple, Stupid") & beginners friendly... ;)
I do hope that nobody ignoring SL ( Stop Loss) ! Without it, It is a fastest way to loose hard earned money...
;)
Trade safe & don't do "gambling". In the end it never pays, not worth it to risk loose all your $...
PS: above technical analysis is done for the community & educational purpose only! It is not a financial advice. Just share my very own insight to it.

COSMOS / USDT – Daily OutlookDaily structure shows a bullish Market Structure Shift (MSS), confirming a short-term trend change.
Price is currently trading above key structure, however:
The 50% retracement (~2.30) marks the optimal discount zone
Multiple unfilled FVGs remain below current price, increasing pullback probability
Key considerations:
- Long continuation is favored after retracement
- Lower timeframe confirmation remains required
- Aggressive entries above current price carry elevated risk
Bias remains bullish, but patience is required.
If this analysis added value or offered a new perspective, consider leaving a like 👍
Feel free to share your view in the comments — constructive discussion helps everyone improve.
MrC

Cosmos (ATOM): Perfect Momentum For Long | Reversal HappenedATOM has had a decent reversal recently, which, in my opinion, could lead the price toward the major resistance area. After the huge dip we had (a correctional candle or a liquidity sweep, however you want to call it), price moved heavily away from the major support zone, which was broken during that move.
Since then we’ve been waiting for a retest of that zone, and now after the downside pressure faded and a proper reversal formed, momentum looks almost perfect for a bullish move to develop.
Swallow Academy

ATOM is still bullish (8H)ATOM price has recently shown a sharp and powerful impulsive move from the bottom, which clearly indicates the presence of strong institutional and smart money buyers. This aggressive reaction from demand zones suggests that buyers are in control of the market structure at the moment.
The bullish momentum is very strong, and price is respecting higher highs and higher lows. As long as this momentum remains intact, minor pullbacks and shallow corrections can be considered healthy and optimal opportunities to enter Buy/Long positions, rather than signs of weakness.
From a market structure perspective, we can clearly identify a Bullish Change of Character (CHoCH) on the chart. This CH confirms that the previous bearish structure has been broken and the market has officially shifted into a bullish phase. Additionally, price is currently trading around key levels, which further increases the importance of this zone and validates the bullish scenario.
Entry Strategy (DCA Approach)
We have two potential entry zones, marked on the chart. These entries can be executed using a DCA (Dollar Cost Averaging) strategy to reduce risk and improve the average entry price. This approach allows better position management in case of short-term volatility.
Targets & Trade Management
All targets are clearly marked on the chart.
At Target 1, it is recommended to secure partial profits to reduce exposure.
After reaching the first target, move the stop loss to Break Even to protect capital and allow the trade to run risk-free.
Remaining positions can be held towards higher targets as long as bullish structure and momentum remain valid.
Final Thoughts
As long as price holds above key support levels and maintains its bullish structure, the overall bias remains bullish. Always manage risk properly and avoid over-leveraging, especially in volatile market conditions.
⚠️ This analysis is not financial advice. Always do your own research and manage risk accordingly.
If you would like us to analyze a coin or altcoin for you, first like this post, then comment the name of your altcoin below.

ATOM / USDT – Weekly OutlookATOM is still trading in a long-term downtrend, but price is currently resting on a major historical support zone.
Market Structure
Clear sequence of lower highs, confirming bearish structure
Strong support zone that has been defended multiple times in the past
No confirmed trend shift yet
Key Zones
Support: current range where price is consolidating
Resistance: previous support that must be reclaimed and held
Above resistance, upside momentum can accelerate
Scenario
As long as support holds, a relief bounce is possible
Rejection at resistance would confirm trend continuation
Only a clean reclaim and hold above resistance would signal trend reversal
Do you expect ATOM to bounce from support or continue lower?
MrC

TradeCityPro | ATOM Testing Support as Bears Dominate👋 Welcome to TradeCityPro’s first analysis of 2026!
In this analysis, I want to review the ATOM coin for you. One of the DeFi projects in the Osmosis ecosystem, which with a market cap of $937 million is ranked 63rd on CoinMarketCap.
⏳ 4-hour timeframe
On the 4-hour timeframe, this coin has a bearish trend and has now entered a correction and ranging phase, preparing to start its next move.
✨ The main support level we have on ATOM is 1.834. However, the price has also formed another support at 1.916, which it has previously touched several times and has now reached again.
✔️ After the previous bearish wave ended, the price corrected upward, and after reaching 2.103, bearish momentum entered the market again.
🧮 Currently, the price is sitting on the 1.916 support. Given the bearish momentum and the increasing selling volume, the probability of breaking 1.916 has increased.
⚡️ With the break of 1.916, we can open a short position.The main trigger for confirming ATOM turning bearish is the break of the 1.834 level.
⛏ However, if the price gets supported from this area and moves upward, breaking 2.103 will give us the first confirmation of ATOM turning bullish.
📈 Personally, I prefer to only open short positions on ATOM for now, since it has a strong bearish trend, and for long positions, we can use other coins that have bullish structures.
📝 Final Thoughts
Stay calm, trade wisely, and let's capture the market's best opportunities!
This analysis reflects our opinions and is not financial advice.
Share your thoughts in the comments, and don’t forget to share this analysis with your friends! ❤️

Sell short amazing The trend is currently down, and the two white lines I drew are the sell zone. And once the price reaches this area, it is expected to fall again unless it breaks this ceiling upwards, in which case the trend will change.
If you create a sell spot, you can expect to make approximately 20% profit without leverage.

Cosmos (ATOM): Waiting For More Clarity | Expecting a ReversalATOM is still following the same downside pattern we’ve been seeing, which keeps the risk of another leg lower on the table. Structure remains weak and as long as price stays below the EMAs, sellers still have control.
That said, we’re entering a volatile period with the new year, so two scenarios matter here. If the local low fails, the move likely extends toward the doomsday low zone. On the flip side, a proper reversal would require price to reclaim both the 100 and 200 EMA, with the 200 EMA being the key level that needs to be secured for any meaningful upside continuation.
Until one of these scenarios plays out, we wait.
Swallow Academy

Cosmos (ATOM): Looking For More Clarity | Expecting ReversalATOM is still following the same downside pattern we’ve been seeing, which keeps the risk of another leg lower on the table. Structure remains weak and as long as price stays below the EMAs, sellers still have control.
That said, we’re entering a volatile period with the new year, so two scenarios matter here. If the local low fails, the move likely extends toward the doomsday low zone. On the flip side, a proper reversal would require price to reclaim both the 100 and 200 EMA, with the 200 EMA being the key level that needs to be secured for any meaningful upside continuation.
Until one of these scenarios plays out, we wait.
Swallow Academy

ATOMUSDTHi all...
mery Christmas friends...
ATOM is showing some strengh to buy at this price. the ichimuko , EMA , BB, and smart money systems are accepting too...
please analyse it for yourself

ATOM/USDT short-term🔍 Market Structure
Clear downtrend – price is moving within a descending channel (lower highs and lows).
Each bounce is sold at the upper band of the channel.
No signal of a change in structure yet (no HH + HL).
📉 Current Price Status
Price is at the lower end of the channel.
Consolidation after a downward impulse → typical bearish continuation or short technical rebound.
Current Zone:
~2.02–2.05 USDT – local support + demand reactions.
🟢 Key Levels
Support
2.049 – local support (current reaction)
1.999 – strong psychological support
1.951
1.878 – lower demand zone (important!)
Resistance
2.099
2.125
2.201 – key resistance / S→R flip.
Upper channel line (~2.20–2.23)
📊 Stochastic RSI
Oscillator often in oversold territory.
Currently recovering from the low → possible short rebound.
BUT: in a downtrend. The Stoch RSI is not a long-term signal.
➡️ More likely a pullback, not a trend change.
🧠 Scenarios
🔴 Baseline scenario (most likely)
Bounce to:
2.09 → 2.12
Rejection + further decline:
1.99
then 1.95 / 1.88
➡️ Short at resistance levels in line with the trend.
🟢 Alternative scenario (less likely)
Breakout of 2.20 + close of the 1H candle above the channel
Retest from above
Then targets:
2.28
2.35–2.40
➡️ Only then can we talk about a change in structure.

Cosmos (ATOM): Looking For Break of Bollinger Bands Middle LineATOM is still trading inside this slow bleed, but the last reaction from the smaller support shows buyers are trying to hold the zone. We already saw one pickup from this level, meaning this area stays the key region for any bullish attempt.
For upside, we need a proper structure break first. Price has to break above the middle BB/trendline and show buyers reclaiming it. Only then the long setup starts to make sense, as the whole trend is still leaning bearish until that shift happens.
If we get a clean MSB + break above the red trending line, the next targets open up quickly since liquidity above recent highs hasn’t been taken yet. Until then, patience — let the confirmation come.
Swallow Academy

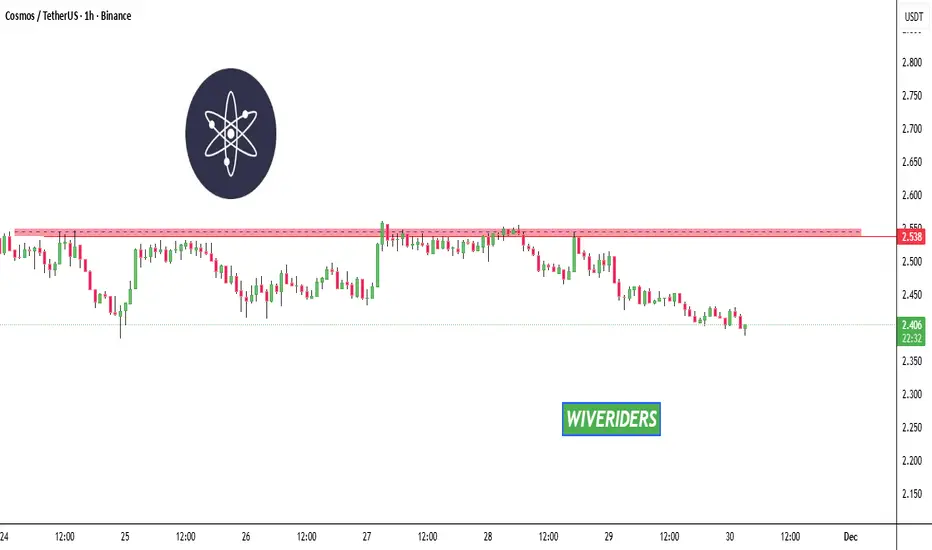
ATOM Update🚨📊 ATOM Update
ATOM has also formed a new resistance zone in red 🔴.
This level is now acting as a strong ceiling,
and price must break out above this red resistance
to show any real bullish momentum again.
Until that breakout happens,
sellers remain in control and upside stays limited.
$ATOM 1H - Bull FlagNASDAQ:ATOM 1H Chart
Price is forming a clean bull flag right on top of the 15m FVG support zone.
A breakout above the flag resistance opens the path for the next leg up, targeting a strong +3% move.
#COSMOS #ATOM
