ATOMUSDT - A QUICK SELL SET UP - 09-02-2026ATOMUSDT - G-Money's short version analysis based purely on technical analysis only, no nonsense or "BS". I do totally ignore any fundamental analysis, technical analysis only
ATOMUSDT - still kinda on the "move" and continue DOWN...
Who did enter this trade earlier congratulations! Who missed it..

Cosmos: ready for recovery? key levels and targets aheadCosmos. Tired of watching this thing bleed and finally show some life? Lately, according to market sources, Cosmos has been back in the news with talk about new app-chains and upgrades around shared security, and the market usually wakes up when that narrative returns. On top of that, majors are cal

ATOMUSDT.P📊 ATOM/USDT Technical Analysis
Market Update:
The price action on ATOM/USDT is following our projected path perfectly. After a sweep of liquidity, the price reached our Invalidation Zone and faced a strong rejection.
Key Technical Levels:
Rejection Point: The price hit the QM (Quasimodo) and BPR (


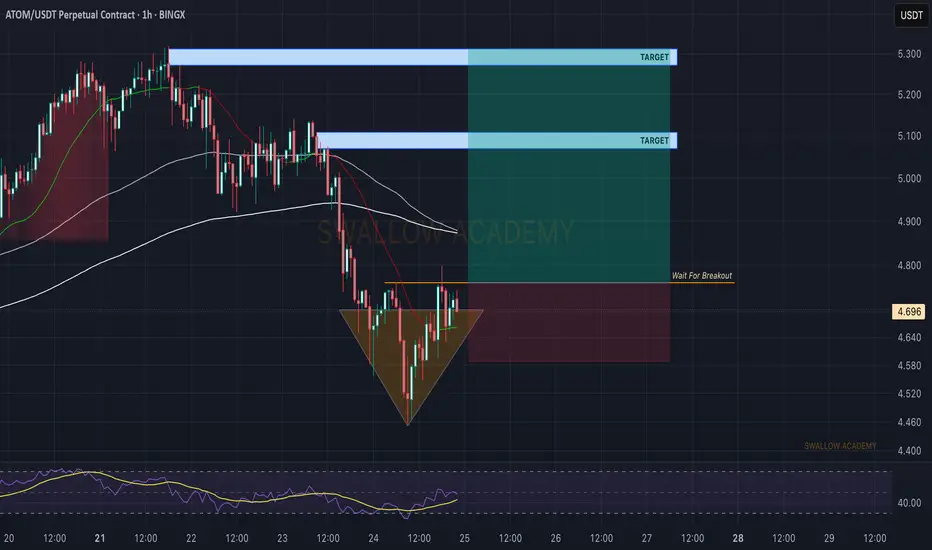
Cosmos (ATOM): Waiting Is Key | Potential Breakout IncomingCosmos might have a good buying opportunity soon, where we are looking for a proper MSB, which would confirm our bullish scenario for this setup here.
As soon as we get the MSB, we are going to look for a buying opportunity.
Swallow Academy
Cosmos (ATOM): Seeing Good Buying Opportunity | BULLISH AFCosmos is pushing strongly, giving us a sign of potential upward movement to happen anytime soon. So let's keep an eye on the 200 EMA and wait for a breakout from there.
More in-depth info is in the video—enjoy!
Swallow Academy

ATOMUSDT Weekly Supply Holds, Continuation Lower Still FavoredATOMUSDT remains structurally bearish after a prolonged distribution phase, with repeated rejections from major weekly supply zones at the $13–$17 and $40 regions confirming long-term seller dominance. Price has broken down from a compression structure near the $4.0–$3.5 immediate supply, accelerati

Atom is bullish above the level atom is bullish if could manage to get out of the channel and above specified green level toward its tp

$ATOMUSDT QUICK ANALYSIS (1H)Cosmos ( BINANCE:ATOMUSDT ) is showing a bullish price setup on the 1-hour timeframe, supported by a clear Break of Structure (BOS) and strong demand-zone reaction.
According to the chart, ATOM price has retraced into a key demand zone between $1.949 and $1.941, an area where buyers previously step

ATOM / USDT - A QUICK SELL SET UP - 29-01-2026ATOM-USDT G-Money's short version analysis based purely on technical analysis only, no nonsense or "BS". I do totally ignore any fundamental analysis, technical analysis only
ATOM / USDT still kinda on the "move" and continue DOWN...
Who did enter this trade earlier congratulations! Who missed it.

See all ideas
Summarizing what the indicators are suggesting.
Oscillators
Neutral
SellBuy
Strong sellStrong buy
Strong sellSellNeutralBuyStrong buy
Oscillators
Neutral
SellBuy
Strong sellStrong buy
Strong sellSellNeutralBuyStrong buy
Summary
Neutral
SellBuy
Strong sellStrong buy
Strong sellSellNeutralBuyStrong buy
Summary
Neutral
SellBuy
Strong sellStrong buy
Strong sellSellNeutralBuyStrong buy
Summary
Neutral
SellBuy
Strong sellStrong buy
Strong sellSellNeutralBuyStrong buy
Moving Averages
Neutral
SellBuy
Strong sellStrong buy
Strong sellSellNeutralBuyStrong buy
Moving Averages
Neutral
SellBuy
Strong sellStrong buy
Strong sellSellNeutralBuyStrong buy
Displays a symbol's price movements over previous years to identify recurring trends.