$ATOM has formed a Long-Term Bottom (TP1 @ $70)NASDAQ:ATOM just printed a textbook reaction off the 0.886 Fibonacci retracement (.114), which is often the final liquidity sweep before a true expansion leg begins. In strong continuation structures, the 0.618 and 0.786 levels test conviction — but the 0.886 is where weak hands are flushed and positioning resets. The precision of this bounce suggests accumulation rather than random support. From this structure, the 1.118 extension projects to $70. which aligns almost perfectly with the psychological $70 level, which is my TP1 zone.
NASDAQ:ATOM is increasingly positioning itself as infrastructure suitable for institutional participation — app-chain sovereignty, flexible security models, and customizable execution environments all align with how institutions prefer to deploy capital. If this pivot gains traction, NASDAQ:ATOM transitions from being priced as an alt L1 beta asset to being valued as infrastructure.
What traders are saying

Cosmos Near Key Support — Bounce Setup Into $2.20 This Week:Current Price: 1.96858 (Analysis was generated on Monday Morning)
Direction: LONG
Confidence level: 58%(Price is holding just above a widely watched support zone, several traders favor dip-buying, and short-term risk–reward favors upside despite mixed momentum signals.)
Targets
Target 1: 2.00
Target 2: 2.20
Stop Levels
Stop 1: 1.85
Stop 2: 1.70
Key Insights:
Here’s what’s driving this setup. Cosmos has been drifting lower, but it hasn’t lost structure. Several traders are watching the $1.80–$1.85 area closely, calling it a make-or-break support where buyers tend to step in. Price is now hovering just above that zone, which shifts the odds toward a bounce rather than an immediate breakdown.
What caught my attention is that while momentum indicators are soft, volume picked up slightly on the dip. That usually means selling pressure is losing steam. On top of that, social chatter leans more optimistic than pessimistic, with traders talking about accumulation rather than panic selling.
Recent Performance:
ATOM has slipped about 2–3% over the last 24 hours, trading down from the $2.05–$2.06 area into the high $1.90s. This pullback followed a failed push above $2.00, but importantly, price held above the prior swing low. That kind of behavior often precedes short-term relief moves, especially when the broader market isn’t collapsing.
Expert Analysis:
Several professional traders are framing Cosmos as a “buy-the-dip” candidate rather than a momentum short. The consensus I’m seeing is simple: as long as $1.80 holds, downside looks limited for this week. A few traders pointed out that reclaiming $2.00 is the trigger that can quickly open the door to the $2.20 zone, which lines up with prior resistance.
At the same time, traders are realistic. They’re not calling for a massive rally yet. This is a tactical long, not a moonshot, and that’s why targets stay tight and stops are clearly defined.
News Impact:
The IBC upgrade going live keeps Cosmos fundamentally relevant, even if the market hasn’t fully priced it in yet. There’s also chatter around cross-chain expansion and partnerships, which helps keep longer-term sentiment constructive. In the short run, the bigger driver remains overall crypto market tone, especially Bitcoin and Ethereum, but there’s no fresh negative headline hitting ATOM right now.
Trading Recommendation:
Putting it all together, I’m going LONG on Cosmos for a short-term bounce. I like entries near current levels with a clear invalidation below $1.85. If buyers manage to push price back above $2.00, momentum traders are likely to chase it toward $2.20 within the week. Risk stays defined, upside is reasonable, and the setup makes sense given where price is sitting.

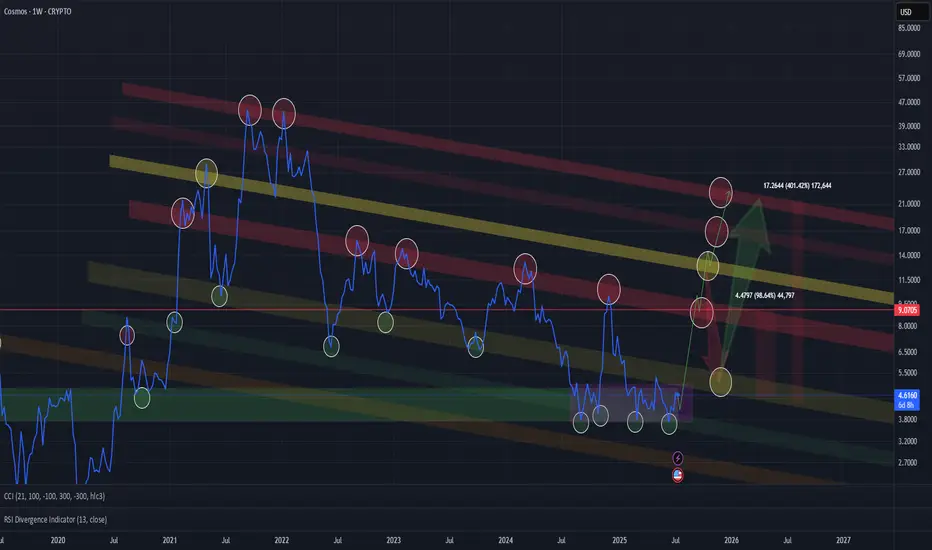
ATOM / USD – Weekly Timeframe AnalysisATOM remains locked in a multi-year downtrend, respecting a well-defined descending resistance and support channel.
🔴 4 Failed Breakout Attempts
Price has rejected the red resistance line four times, with rallies ranging from +82% to +205%, each followed by deeper sell-offs. This confirms strong seller control at higher levels.
🟢 Buyer Zone Holding (So Far)
The green buyer zone has produced 3 significant bounces during the downtrend:
-51%
-59%
-74%
Each bounce has weakened, signaling declining demand strength.
📉 Trend Structure
Lower highs + lower lows = trend still bearish
White MA acting as dynamic resistance
Yellow support trendline is the last major structural support
⚠️ Key Levels to Watch
Buyer Zone: Critical for short-term reaction
Seller Zone (Purple): Major supply area + trendline confluence
Resistance Line (Red): Must be broken on a weekly close to shift bias
📌 Scenarios
A (Bullish Relief): Bounce from buyer zone → retest seller zone → potential rejection
B (Bearish Continuation): Loss of buyer zone → breakdown below support → new lows before any sustainable reversal
💡 Bias:
Until ATOM reclaims the descending resistance on a weekly close, rallies remain sell-the-bounce setups. Patience is key — structure > hope.

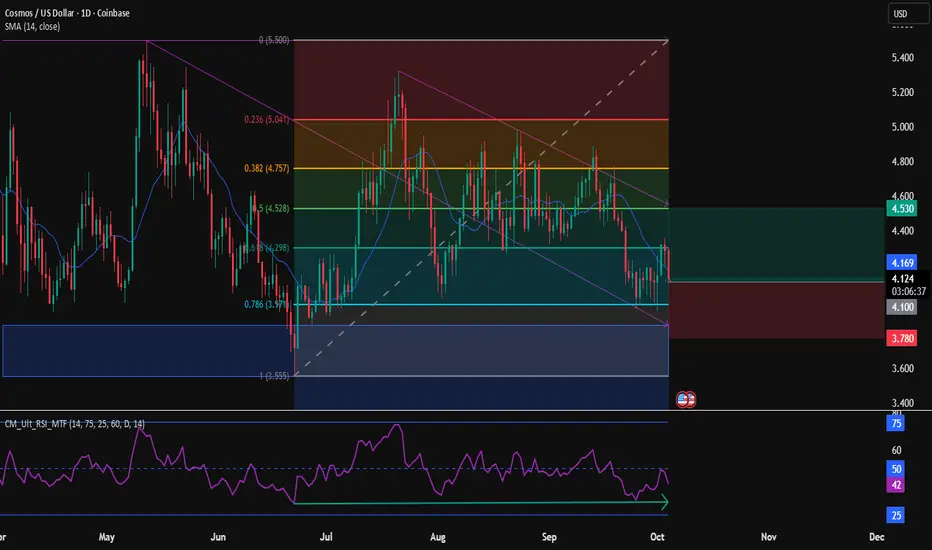
COSMOS ATOM; Nice bounce possible short consolidationA few days ago, I mentioned that ATOM had likely bottomed and that we could see a strong move in January. As expected, price has already climbed about 46%.
At this point, ATOM may need a short consolidation as some investors take profits. There’s a possibility we see a retrace toward the 0.5 Fibonacci level around $2.23, which could act as a healthy reset and provide the momentum needed for the next leg up.
From there, a bounce could set us up to challenge the EMA 100 near $2.71. Once we reach that area, market sentiment will be key. If bullish momentum continues, that should give ATOM enough strength to push toward — and potentially break — the EMA 200.
What are your thoughts? Don’t forget to follow and share. 🚀

Cosmos (Atom): Looks like we hit the floor Bullish January!Since 2019 between 1.89 to 1.06 has been the extreme floor level looks like we are currently testing 1.87 I think we are almost ready for a nice bounce up. 2019 we were in a Long boring Accumulation that lasted about 686 days but right after that we climbed dramatically to 7,725% soon after we did a double top and dropped and ever since have been in a downtrend for about 1,204 days. I believe we are close for a breakout most likely January. Please leave comments about what you guys think.

Atom In a Clear Supply Zone and primed for reversal. Sizing longAtom is in a critical zone for its future. zone has historically produced reactions and turn arounds. im adding and sizing into my long

Atom Long opportunity Atom has reached a critical level that has acted as a supply/support zone since its beginning days. I entered a 10x long at 2.08. See You all at 2.40 then 3.

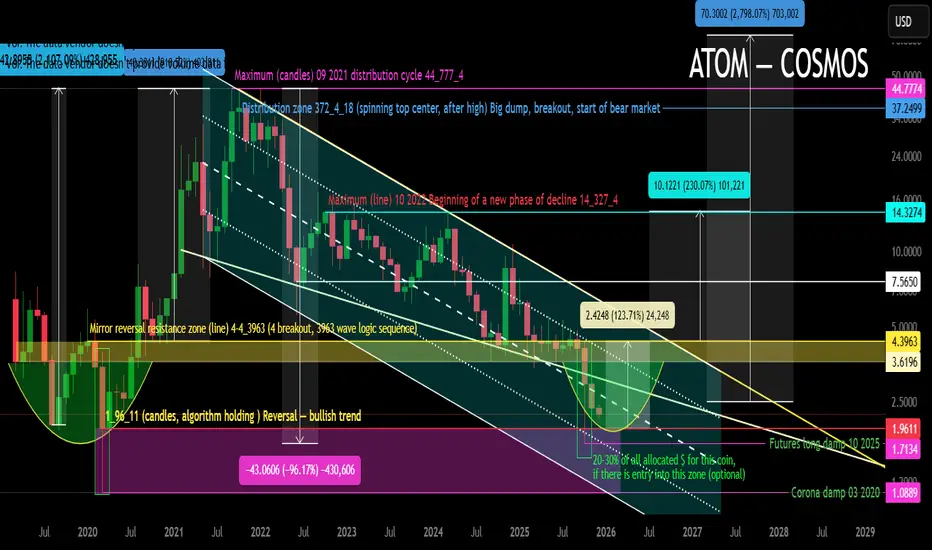
ATOM - COSMOS. Main Trend 12 2025Logarithm. 1-month time frame to visualize the primary trend. Price is in a downward secondary trend channel right at the distribution zone of the 2021 super hype wave. The hype is dead, but it's highly likely to revive when it makes sense from the overall market perspective. That's why, after so many years, I'm publishing this idea + I'll show you something else.
1-month time frame
3-day time frame.
Buy fear in increments, in accumulation zones, sell joy in increments, in selling zones.
Any purchase, including at the market, is acceptable and very cheap from the perspective of the primary trend and its potential (even secondary). If you also manage the risks of asset diversification (avoid buying dying "schoolboy candy wrappers" or "promising junk" on hype or listings, which are the same thing), and entry/exit amounts, rather than slapping a stop-loss after every purchase, where it's needed (short-term breakouts of trend movements, distribution trading) and where it's not needed (capitulation, reversal zones with a clear outcome), but the book says it's mandatory (liquidity collection by exchanges and large market participants, algorithms, through the cloned actions of the majority). Then you'll experience peace and profit over time, that is, speculative "Zen."
1) Your intelligence level.
2) Trading plan.
3) Risk control. This correlates strongly with discipline (maturity, experience) and the first point.
If you lack any one of the above three points (one doesn't work without the other), then give up investing and trading, as you'll always be an underdog, and any fleeting wins (accidents or being "baited" into you) won't matter. After all, in the long run, you'll never have anything but emotional devastation and regret. This applies to any activity related to money and responsibility.
Risk must always be justified and controlled by you. This is the foundation of foundations. If this isn't the case, then you're building a speculative house on a clay foundation, trying only to guess the price. Sooner or later, it will collapse, and the later it happens, the more painful it will be.
🧠 Information for self-improvement only for the more savvy.
No one needs this, because you'll be inventing something that doesn't exist. Standard TA logic + risk management are sufficient for making money.
The algorithm's "levels" (coinciding with support/resistance zone levels, which is logical) are all set using a magnet, precisely based on numerical values (not everyone needs to understand this; it's a bonus, nothing more). I specifically only used a large time frame (month) and key trend direction zones to keep things simple. I've already demonstrated this many times, whether you understand it or not. Some magnet levels are based on candlesticks (lows and highs), while others are based on the trend direction (linear). I've indicated it in parentheses.
As the price showed many years later (trend development), as planned (trend direction and key areas), so it was all created by an AI algorithm "that doesn't exist," like "Aladdin squared." Oh, yes. It's a conspiracy theory... Open your eyes...
Markets are driven by capital according to rationality, according to its actions (buying at lows creates news horror, selling at highs creates news euphoria), which equals profit. Governments play a huge role in this, especially the government of a "global democracy."
Atom , update .Didn’t went well as 4 years cycle fooled most of us and almost at the. Mars 2020 level , now that we left the 4 year cycle behind I can see clearly that we hit the bottom, RSI bullish divergence with price channel tightening tells us a possible reversal is on the edge, for me an ATH is ideal and possible, remember the history is being written by tough times.

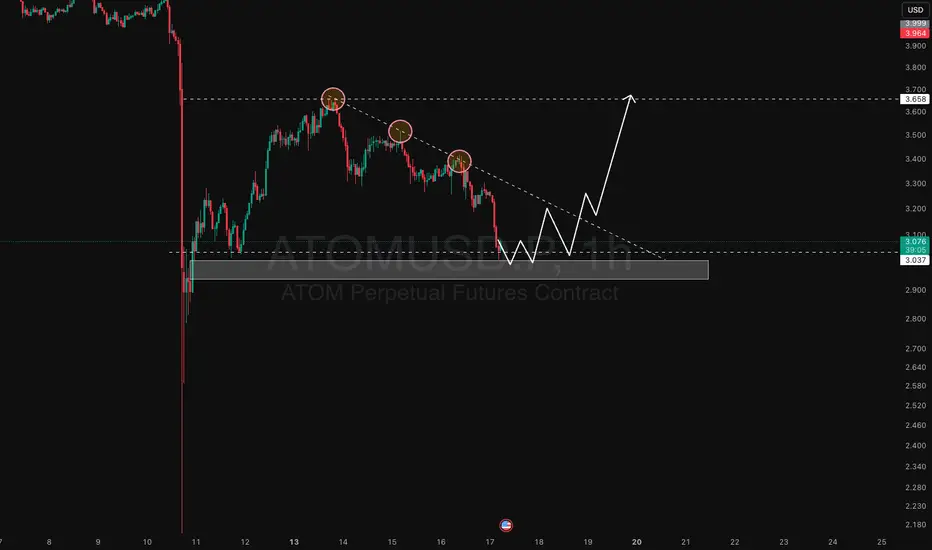
ATOMUSD⬆️ Buy Range: 3.000 - 2.870
⏹️ Stop Loss: 2.500
*️⃣ Take Profit: 3.680 - 3.900
🔠 Technically, the price is expected to rise from a strong medium-term support range with a breakout of the upper boundary of the local descending channel and further upward movement to the 4.000 region.

ATOM BOUNCE???ATOM/USDT Update:
Price is currently forming a descending triangle pattern, showing consistent lower highs while holding the same support level. 📉
We’re now sitting right at support, so this is a key area to watch. Let’s see how price reacts here — a strong bounce could lead to a recovery, but a break below would confirm further downside.
Alternatively, a break of the trendline would signal potential reversal and long opportunities ahead.
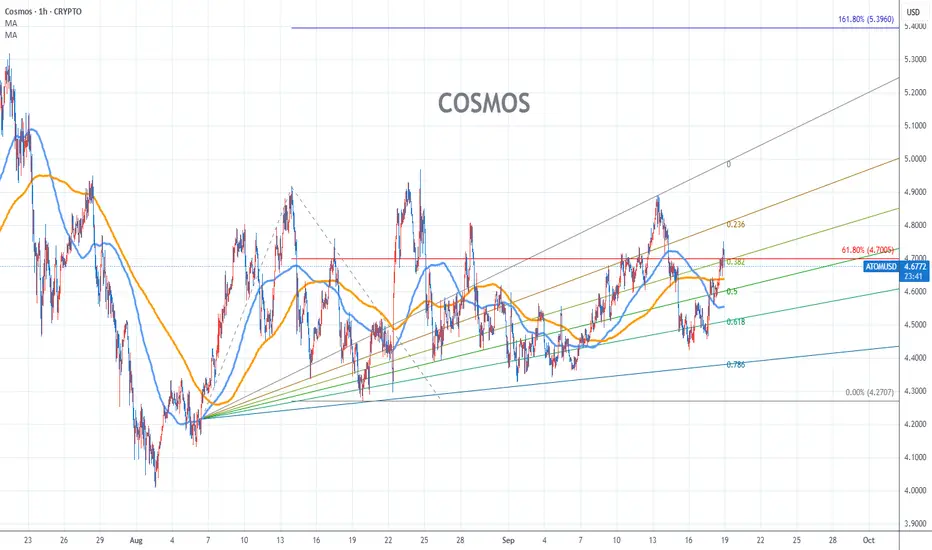
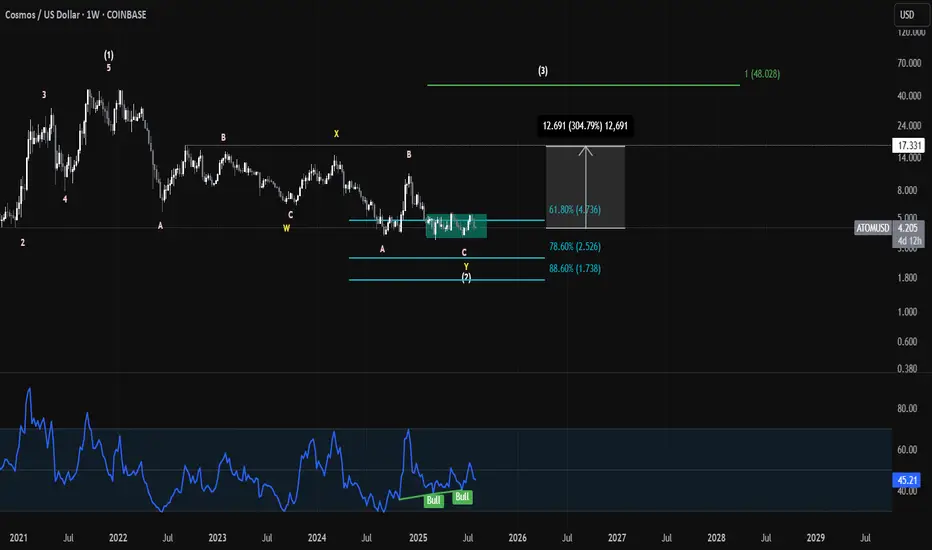
Cosmos Chart Fibonacci Analysis 091825Trading Idea
1) Find a FIBO slingshot
2) Check FIBO 61.80% level
3) Entry Point > 4.7/61.80%
Chart time frame:B
A) 15 min(1W-3M)
B) 1 hr(3M-6M)
C) 4 hr(6M-1year)
D) 1 day(1-3years)
Stock progress:A
A) Keep rising over 61.80% resistance
B) 61.80% resistance
C) 61.80% support
D) Hit the bottom
E) Hit the top
Stocks rise as they rise from support and fall from resistance. Our goal is to find a low support point and enter. It can be referred to as buying at the pullback point. The pullback point can be found with a Fibonacci extension of 61.80%. This is a step to find an entry-level position. 1) Find a triangle (Fibonacci Speed Fan Line) that connects the high (resistance) and low (support) points of the stock in progress, where it is continuously expressed as a Slingshot, 2) and create a Fibonacci extension level for the first rising wave from the start point of the slingshot pattern.
When the current price goes over the 61.80% level, that can be a good entry point, especially if the SMA 100 and 200 curves are gathered together at 61.80%, it is a very good entry point.
As a great help, TradingView provides these Fibonacci speed fan lines and extension levels with ease. So if you use the Fibonacci fan line, the extension level, and the SMA 100/200 curve well, you can find an entry point for the stock market. At least you have to enter at this low point to avoid trading failure, and if you are skilled at entering this low point, with the fibonacci6180 technique, your reading skill of to chart will be greatly improved.
If you want to do day trading, please set the time frame to 5 minutes or 15 minutes, and you will see many of the low points of rising stocks.
If you prefer long-term range trading, you can set the time frame to 1 hr or 1 day
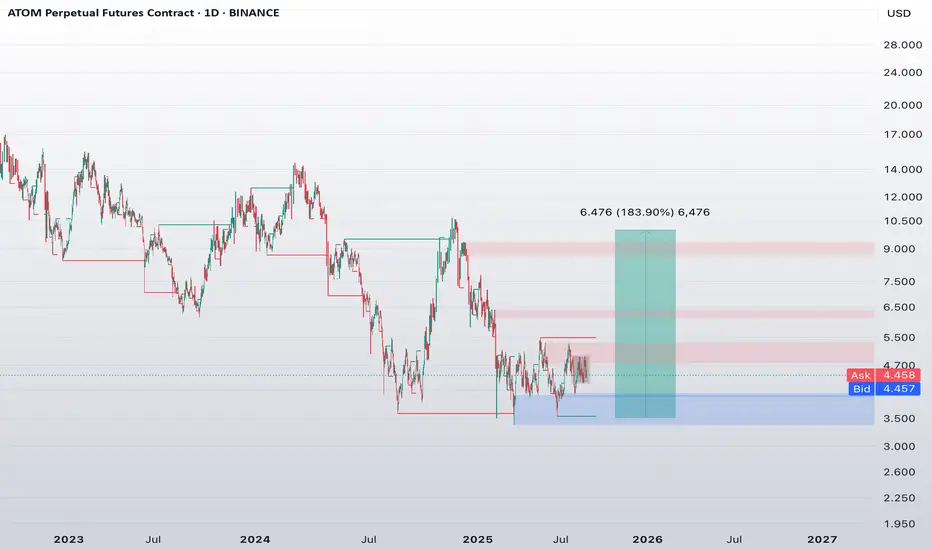
Is there anyone left who still believes in $ATOM at $10?
Looking at the current structure, NASDAQ:ATOM has been ranging for months — slowly building a base around $4.3–4.7. No hype, no attention. Just silence.
But that's exactly where the biggest moves begin.
🔹 Clean consolidation
🔹 Mid-term accumulation zone (blue) holding
🔹 Upside potential: +180% back into the $9.5–10.5 range
🔹 Historical levels of support/resistance still respected
I’m not here to convince anyone. I’m just positioning where the risk-to-reward is asymmetric.
📌 If this thing wakes up — I want to be early, not late.
Do you still believe in the ATOM ecosystem?
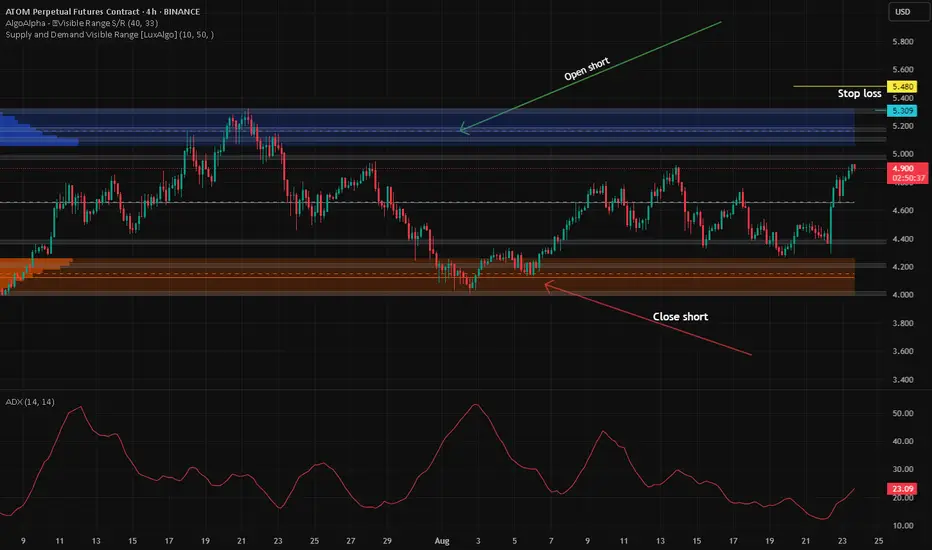
ATOM Short
Short entry positioned at $5.16, aligning with a strong supply zone and major resistance based on the 2.618 Fibonacci extension.
Stop loss set at $5.48, above recent highs and upper resistance to mitigate risk from volatility spikes and potential wicks.
Take profit targeted between $4.23 and $4.03, within a solid historical demand zone on high volume.
Setup offers favourable risk/reward ratio (approx. 1:3).
4H ADX currently at 23, indicating a modest trend but favouring range-bound trading strategies.
Main risk includes the possibility of false breakouts above resistance, leading to stop-outs before a reversal.
Price may find strong support around the take profit zone, causing potential bounce or stalling.
Broader market structure neutral to slightly bullish; range may eventually break after repeated tests.
Setup validity is reinforced if BTC and overall crypto market continue consolidating in established ranges.
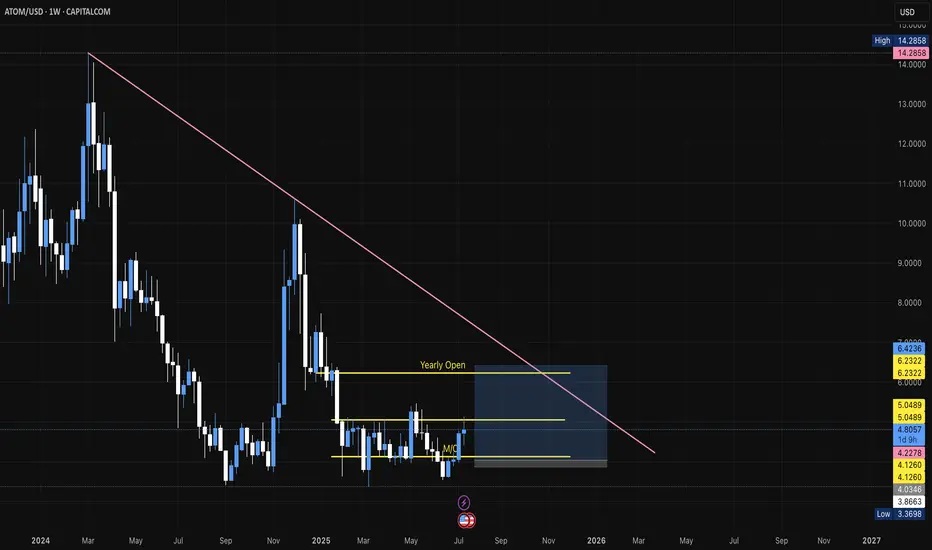
ATOM Swing TradeAs BTC dominance is sliding, which is an early alt season, I'm preparing some bids anticipation of pullbacks. One of the coins that caught my attention is ATOM.
Structurally, it looks bottomed, reclaiming key support around the M/O. My initial target is the Yearly Open, where I’ll take profit and then reassess whether it’s worth holding a long-term position.
100% here is what ATOM is going to doJ/k in the title of course but here's a fun prediction. Would awesome if I get it even a little bit right.
There's a small cup n handle (blue), with a breakout and retest. That's where the price action sits right now.
Zoom out a bit and there's a larger cup (yellow) that could form a handle of it own, and then breakout massively to $19.95 (lols, so precise but complete guess) the 2025 Q4 ALTSEASON.
Cheers!

ATOM (COSMOS)🔹 Accumulation Phase in Play
We’re currently sitting in a clear accumulation zone — price is holding steady, showing signs of position-building by stronger hands.
📈 The next key areas are distribution zones, all of which are already marked on the chart. If you're entering a position now, odds are high you'll be able to secure profits as we move up. Just make sure to set a stop-loss — and don’t get greedy if you're aiming for the top.
⚠️ Even though it’s less likely, there’s a small chance of a shakeout near the yellow zone, but I personally doubt it — the market is already heavily shaken, sentiment is fearful, and many have been waiting for a move for too long.
🕰️ We’re also running out of time — the 4-year cycle is coming to a close by the end of this year. Historically, this aligns with significant market moves
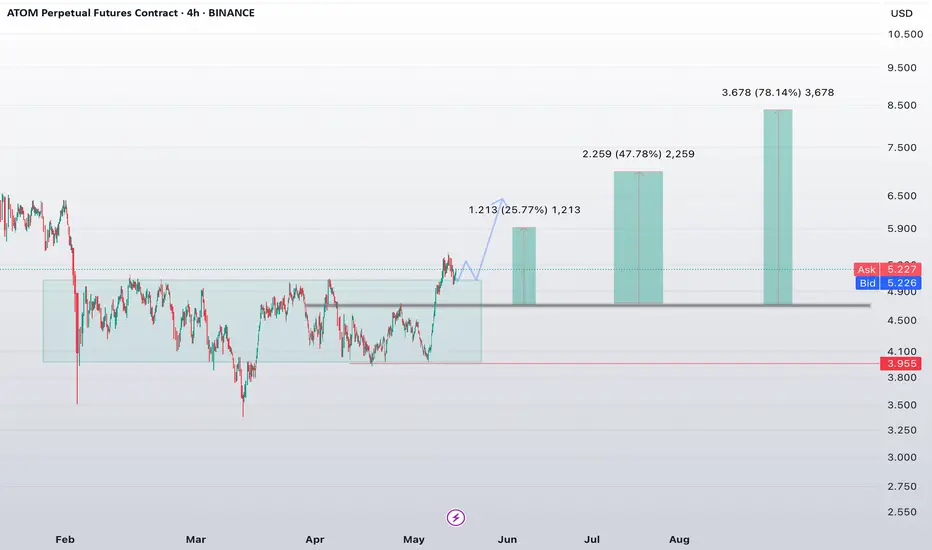
ATOM confirms the breakout!⚛️ NASDAQ:ATOM confirms the breakout!
We've officially broken out of the multi-month range and completed a successful retest from above — the path upward is now open. 🚀
✅ Current price: $5.22
📉 Retest of the $4.80–$5.00 zone held perfectly
📈 Targets on the horizon:
$6.53 (+25.7%)
$7.53 (+47.8%)
$9.00+ (+78%)
🔁 Classic move: accumulation → breakout → retest → trend continuation.
🧠 Those who followed the setup are already in. But even now, NASDAQ:ATOM looks like it still has room to shine.
$ATOM is waking up!⚛️ NASDAQ:ATOM is waking up!
Price is back above $5, and this looks like just the beginning. The daily chart shows a clear breakout from a long accumulation zone. 🚀
✅ Current price: $5.05
📈 Upside targets based on technicals:
$6.26 (+25.77%)
$7.31 (+47.78%)
$8.73–$8.89 (+78%‼️)
📊 Support zone: $3.95
🔁 Classic double-bottom pattern + extended sideways range = perfect setup for a rally.
🧠 NASDAQ:ATOM has always been a core asset of the Cosmos ecosystem. Now, the technicals are finally aligning with the fundamentals.

Global plan for ATOMIn this video I considered the global possible price movement, also made possible scenarios for the current week
Write a comment with your coins & hit the like button and I will make an analysis for you
The author's opinion may differ from yours,
Consider your risks.
Wish you successful trades! MURA

Atomusdt long to $4.73+Just now opened a long position on atom.
Targeting $4.73+
Aiming to take partial at $4.586 area
then move stop to BE and hold the rest. Potentially scaling back in again if doesn't push straight to tp.
4.47 stop or lower.
