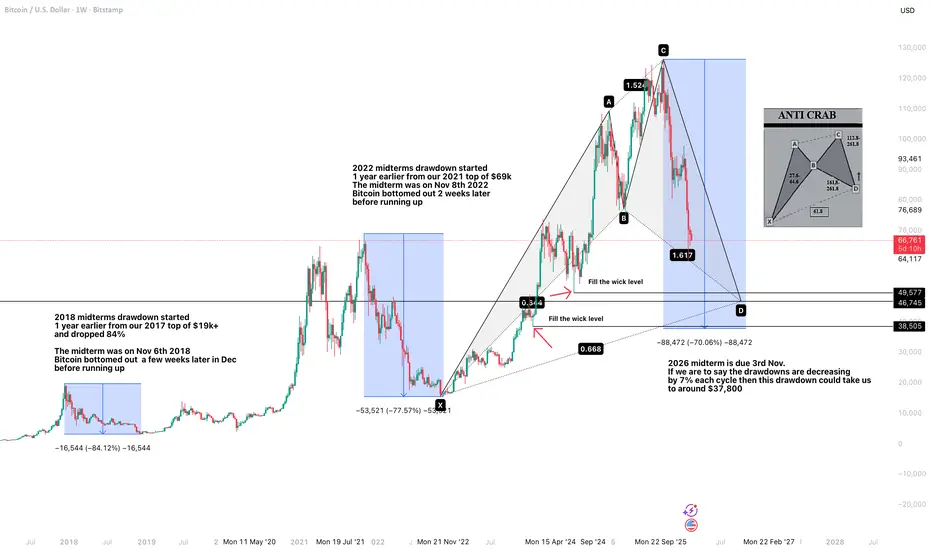
Btc and the midterm election cycles2026 sees the midterm election over in the USA, these midterms seem to have an adverse effect on the bitcoin price as you can see from what I've drawn.
I've looked back to the last 2 midterms, 2018 and 2022 and both have the same conclusion, large drawdowns. 2018 saw an 84% price decrease on bitcoi

The best trades require research, then commitment.
Get started for free$0 forever, no credit card needed

Scott "Kidd" PoteetPolaris Dawn astronaut

Where the world does markets
Join 100 million traders and investors taking the future into their own hands.
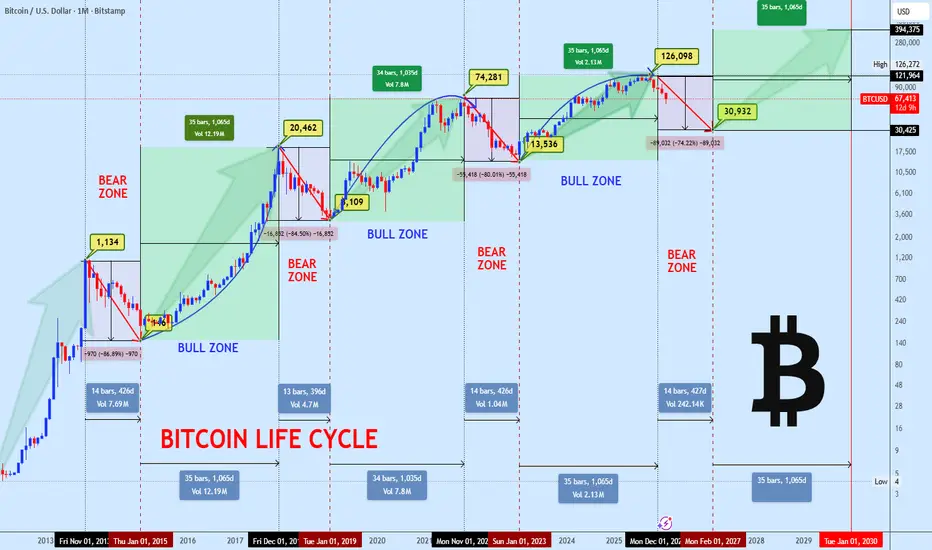
BITCOIN MACRO UPDATE LIFE CYCLE, STRUCTURE & PRICE LEVELSIt is timely to revisit the typical crypto market cycle, as Bitcoin continues to respect it with remarkable precision.
The macro top was confirmed in October, when BTC tested the $126,000 zone, marking the current cycle ATH. Since that rejection, price has transitioned into a prolonged consolidat
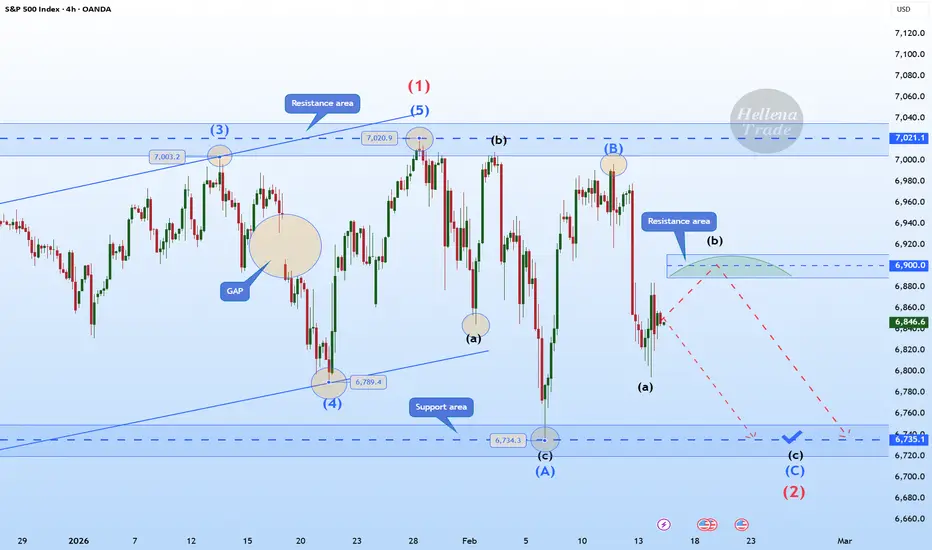
Hellena | SPX500 (4H): SHORT to support area of 6735.Colleagues, it seems that we are facing a combined correction, which means that wave “2” is not yet complete and we should expect a price decline to the support area of 6735, where I think we should take profits.
As part of a small “abc” correction, it is possible to reach the 6900 area before the
Bitcoin: 80% 80K Price Objective. While the Broader structure is pointing bearish, recent consolidation after testing the 60K area support suggests a potential bullish retrace with an 80K price objective. There are 3 key support areas or "order blocks" to be aware of. The 59K to 60K (weekly) and the 66K to 68K area where price is fl

Bitcoin - Small correction before a big move upBitcoin is currently trading around $70,000 after recovering from a recent low. The market structure on the 4-hour timeframe shows a clear reaction from a liquidity event followed by a controlled move higher. However, price is now approaching a decision point as momentum begins to slow. The interact

NVDA - Techs Fail and Insiders BailThis chart looks ugly for the bulls. That red trendline has been holding the price up for months, but now it is finally giving way. When a major support level like this cracks, it usually means the uptrend is over and we are heading lower.
But the real red flag is what the leadership is doing.
Ins

Nvidia May Be RangeboundNvidia has gone nowhere since October, and some traders may think the AI giant is rangebound.
The first pattern on today’s chart is the December 26 high of $192.69. NVDA probed that level in late January and again this month without breaking out. That may suggest that resistance is in place.
Secon

Nasdaq Crash Incoming: Wave 3 of 3 DownOver in this video, I go through the 5th wave up and identify 2 key things for this top:
1. Wave 5 = Wave 3, since wave 1 is the longest, wave 3 cannot be the shortest wave.
2. 2 Spinning tops marks the peak on 29th and 30th Oct 2025.
The first wave down is a "leading diagonal" because wave 4 overl

Bitcoin flashing traditional accumulation signals (alt season?)TL:DR
Bitcoin is finding a bottom but probably still has some downside. Strong hand are probably accumulating Bitcoin and especially alts.
Introduction
Bitcoin is flashing multiple accumulation signals. But this downtrend has been so gradual and lacking in volatility it barely feels like a bea
Bitcoin: Is the WXYXZ Correction Setting Up Wave C?Bitcoin: Is the WXYXZ Correction Setting Up Wave C?
During the last 5 days BTC declined by nearly 5% from 72250 to 65170
Looks like the B wave has more a corrective movement and is expanding as WXYXZ pattern. If the price manages to move above the previous X near 68300 it will add the chances t

See all editors' picks ideas
MovingAveragesLibrary "MovingAverages"
A collection of O(1) numerically stable moving averages that support anchors and fractional lengths up to 100k bars.
Pine Script has a robust set of moving averages suitable for a majority of cases, making these alternatives useful only if you need anchoring, fractional
Pine Script® library

Clusters Volume Profile [LuxAlgo]The Clusters Volume Profile indicator utilizes K-Means clustering to categorize historical price action into distinct groups and generates individual volume profiles for each detected cluster. This tool provides a unique perspective on volume distribution by isolating price behaviors based on prox
Pine Script® indicator

Central Bank Liquidity Gap IndicatorThis indicator measures the gap between global liquidity growth and stock market growth to identify potential buying opportunities.
Liquidity drives markets. When central banks print money, that liquidity eventually flows into stocks and other assets. If we spot when liquidity growth is outpacing
Pine Script® indicator

Peak Trading Activity Graphs [LuxAlgo]The Peak Trading Activity Graphs displays four graphs that allow traders to see at a glance the times of the highest and lowest volume and volatility for any month, day of the month, day of the week, or hour of the day. By default, it plots the median values of the selected data for each period. T
Pine Script® indicator

Smart Trader, Episode 03, by Ata Sabanci, Candles and TradelinesA volume-based multi-block analysis system designed for educational purposes. This indicator helps traders understand their current market situation through aggregated block analysis, volumetric calculations, trend detection, and an AI-style narrative engine.
━━━━━━━━━━━━━━━━━━━━━━━━━━━━━━━━━━━━━━━
Pine Script® indicator

Asset Drift ModelThis Asset Drift Model is a statistical tool designed to detect whether an asset exhibits a systematic directional tendency in its historical returns. Unlike traditional momentum indicators that react to price movements, this indicator performs a formal hypothesis test to determine if the observed d
Pine Script® indicator

Hyperfork Matrix🔱 Hyperfork Matrix 🔱 A manual Andrews Pitchfork tool with action/reaction propagation lines and lattice matrix functionality. This indicator extends Dr. Alan Andrews' and Patrick Mikula's median line methodology by automating the projection of reaction and action lines at equidistant intervals, cr
Pine Script® indicator

Arbitrage Matrix [LuxAlgo]The Arbitrage Matrix is a follow-up to our Arbitrage Detector that compares the spreads in price and volume between all the major crypto exchanges and forex brokers for any given asset.
It provides traders with a comprehensive view of the entire marketplace, revealing hidden relationships among d
Pine Script® indicator

Wyckoff Schematic by Kingshuk GhoshThe "Wyckoff Schematic" is a Pine Script indicator that automatically detects and visualizes Wyckoff Method accumulation and distribution patterns in real-time. This professional tool helps traders identify smart money movements, phase transitions, and critical market structure points.
Key Features
Pine Script® indicator

Volume Cluster Profile [VCP] (Zeiierman)█ Overview
Volume Cluster Profile (Zeiierman) is a volume profile tool that builds cluster-enhanced volume-by-price maps for both the current market window and prior swing segments.
Instead of treating the profile as a raw histogram only, VCP detects the dominant volume peaks (clusters) insid
Pine Script® indicator

See all indicators and strategies
Community trends
Tesla - Not the final breakout yet!🎯Tesla ( NASDAQ:TSLA ) is still in breakout mode:
🔎Analysis summary:
Just recently, Tesla broke out of a significant bullish triangle pattern. But looking at the higher timeframe, this triangle breakout is still not really confirmed yet. Instead, Tesla has to create new all time highs soon in

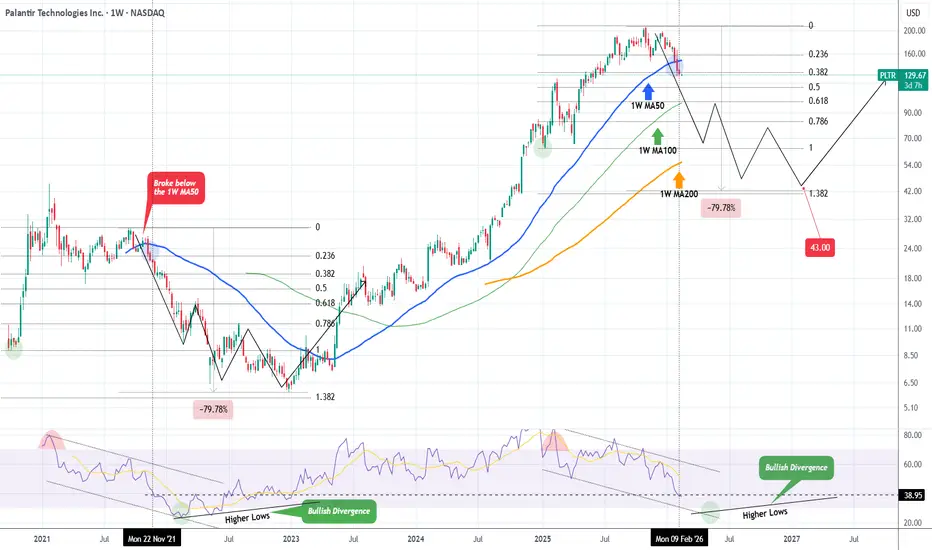
PALANTIR Bear Cycle accelerating. Potential bottom at $43.Palantir (PLTR) was one of the biggest winners of the 2023 - 2025 A.I. driven Bull Cycle but since breaking below its 1W MA50 (blue trend-line) two weeks ago, it has confirmed its new Bear Cycle.
So far this is no different than the previous one in late 2021 - 2022. That Bear Cycle also started whe
Rivian Automotive, Inc. (RIVN) Weekly - VolumeRivian Automotive, Inc. (RIVN) Weekly - Volume
Side trend is completed and up trend is starting.
Regards,

Nebius is looking badNebius has formed a head and should pattern and also complete 6 waves of its correction with 7th (C) wave pending.
There is also a glaring gap on weekly at 28.5 USD. Its going to be a fast move to the downside, I thinking starting from next week.

SMR Nuscale: Bullish SetupSMR looks to be setting up for a bullish reversal, having completed a head and shoulders pattern breakdown off of the October high right to the line of support that price sits at now where we've seen multiple instances of support at over the past couple of years.
A swing trade from current levels

Trendline Support, expecting a bounce higherKarman Holdings Inc has approached its 1 year trend line. As it is in a bullish phase, i expect this to bounce and go for new all time highs. We have seen 4 confluences of support in the past showing that the trend line is strong and intact and a bullish candle will confirm price to the upside.
If


AMD (2026+) Catalysts & Risks: 500 USD PT Bulls🟥 AMD (2025+) Catalysts & Risks: Analyst Views (Updated 2026)
🔑 Key Catalysts Driving AMD’s Stock Growth (2026+)
🌌 Strategic OpenAI & Hyperscaler AI Partnerships
AMD has moved beyond “potential contender” into real hyperscaler deployment territory, with major multi-year AI infrastructure commitme

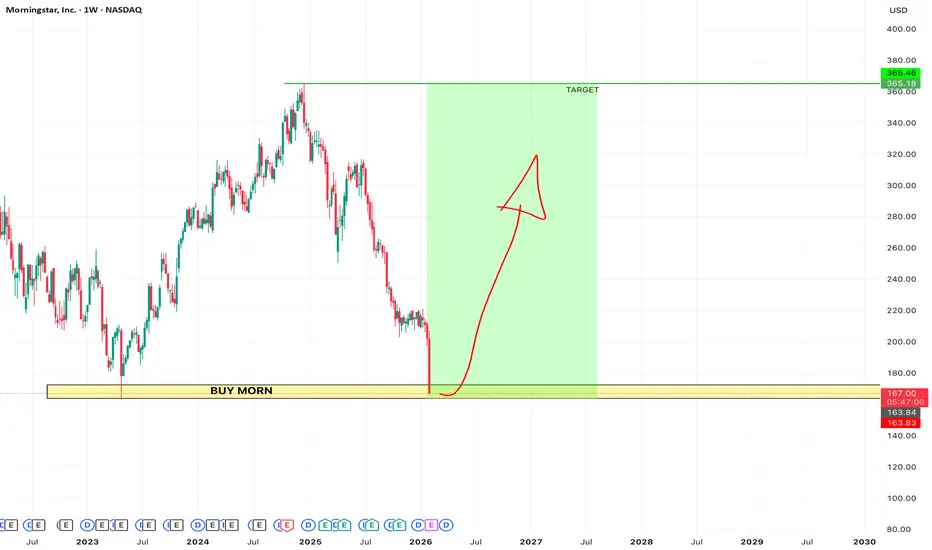
BUY MORNINGSTARAnother opportunity presenting itself in this mad week. Time to stay strong and resilient during these times.
Amazon close to support level - Bullish opportunityAmazon close to support level – bullish opportunity
Amazon is trading near the lower boundary of a rising channel on the daily chart. The broader structure remains bullish, with higher highs and higher lows intact. This looks like a pullback within trend — not a breakdown.
why this level matte

See all stocks ideas
Feb 18
FVRRFiverr International Ltd.
Actual
0.86
USD
Estimate
0.74
USD
Feb 18
CSTMConstellium SE
Actual
0.71
USD
Estimate
0.34
USD
Feb 18
FDPFresh Del Monte Produce, Inc.
Actual
0.70
USD
Estimate
0.28
USD
Feb 18
GLBEGlobal-E Online Ltd.
Actual
0.35
USD
Estimate
0.31
USD
Feb 18
CAMTCamtek Ltd.
Actual
0.81
USD
Estimate
0.81
USD
Feb 18
DINOHF Sinclair Corporation
Actual
1.20
USD
Estimate
0.45
USD
Feb 18
NPOEnpro Inc.
Actual
1.99
USD
Estimate
1.91
USD
Feb 18
TNLTravel Leisure Co.
Actual
1.83
USD
Estimate
1.81
USD
See more events
Community trends
BITCOIN MACRO UPDATE LIFE CYCLE, STRUCTURE & PRICE LEVELSIt is timely to revisit the typical crypto market cycle, as Bitcoin continues to respect it with remarkable precision.
The macro top was confirmed in October, when BTC tested the $126,000 zone, marking the current cycle ATH. Since that rejection, price has transitioned into a prolonged consolidat
Bitcoin - All ETF investors will get liquidated! (here is why)Bitcoin can drop below 40k later this year! But before that, in the short term, we may see a final drop to 58k, followed by a huge bear market rally to 85k. If you are confused, let's take a look at my prediction:
Short-term: 58k (wave A on the chart)
Mid-term: 85k (wave B on the chart)
Long-te

Bitcoin (BTC): Wyckoff Is Telling Us Of Upcoming Big DumpNot a first time we've been looking at the wyckoff structure but since the last time we looked, we had a nice break of the neckline (a major signal of trend reversal).
If we were to base our predictions on Wyckoff structure development, we should soon see a smaller recovery and then another bigger

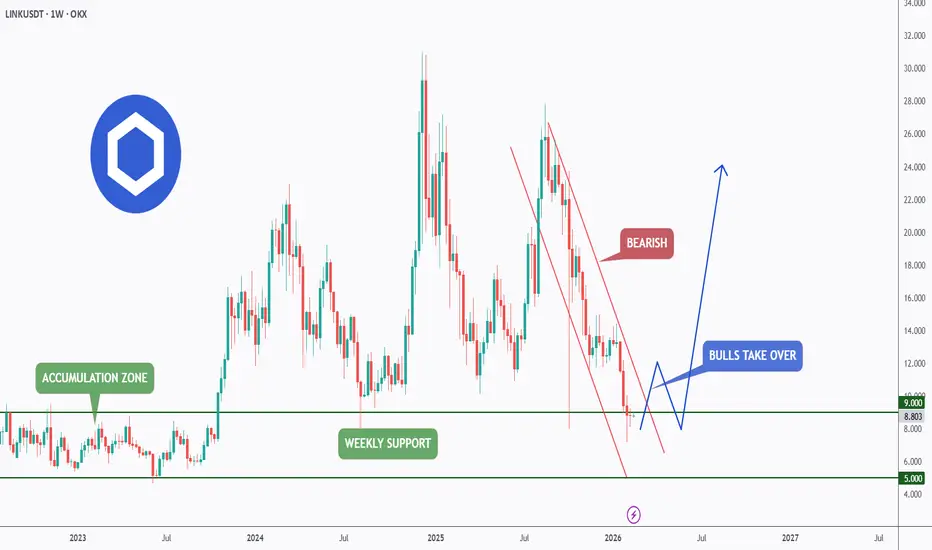
LINK – Weekly Support in PlayLINK is now diving into a major weekly support zone , the same area that previously acted as accumulation.
This is a key level.
As long as this weekly support holds , we will be looking for long-term longs, positioning for the next potential upside cycle.
However , for the bulls to truly take o
ETH Holding Major Support – 2040 Reclaim Opens Path to 2090ETH Holding Major Support – 2040 Reclaim Opens Path to 2090
ETH is reacting strongly from a well-defined support zone around 1935–1950, which has now been defended multiple times.
The repeated wicks into this area show clear buyer interest and absorption after the sharp sell-off from the highs.

BTCUSDT: Coiling for Move - Bearish Bias While Below 70KHello everyone, here is my breakdown of the current BTCUSDT setup.
Market Analysis
BTCUSDT has been trading within a well-defined bearish environment, moving inside a descending channel where price consistently formed lower highs and lower lows. This structure reflected controlled selling pressur

Btc and the midterm election cycles2026 sees the midterm election over in the USA, these midterms seem to have an adverse effect on the bitcoin price as you can see from what I've drawn.
I've looked back to the last 2 midterms, 2018 and 2022 and both have the same conclusion, large drawdowns. 2018 saw an 84% price decrease on bitcoi
BTCUSDT Sellers Defend 69,500, Downside Still in PlayHello traders! Here’s my technical outlook on BTCUSDT (2H) based on the current chart structure visible on the screenshot. BTCUSDT has been trading within a broader bearish environment following a strong sell-off from the highs, where price consistently printed lower highs and lower lows. This decli
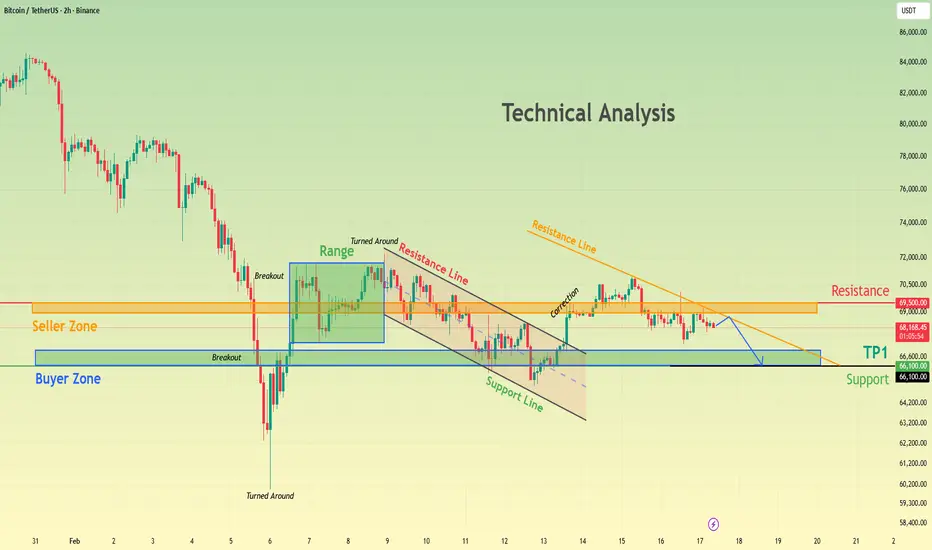
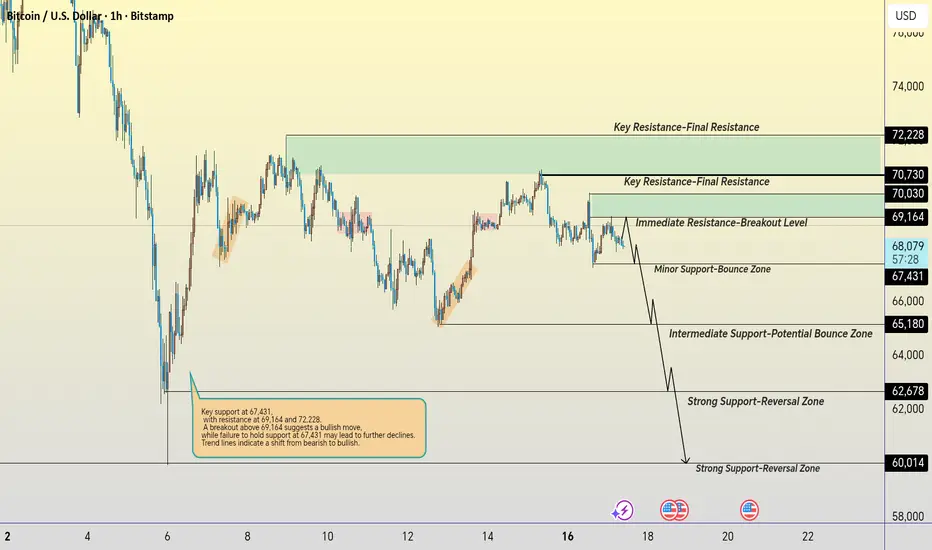
Bitcoin Price Action Analysis: Key Support and Resistance LevelsThis chart outlines critical support and resistance levels for Bitcoin, with key resistance at 69,164 and 72,228. A breakout above 69,164 could signal a bullish move, while failure to hold support at 67,431 may lead to further declines. Trend lines suggest a shift from bearish to bullish sentiment.
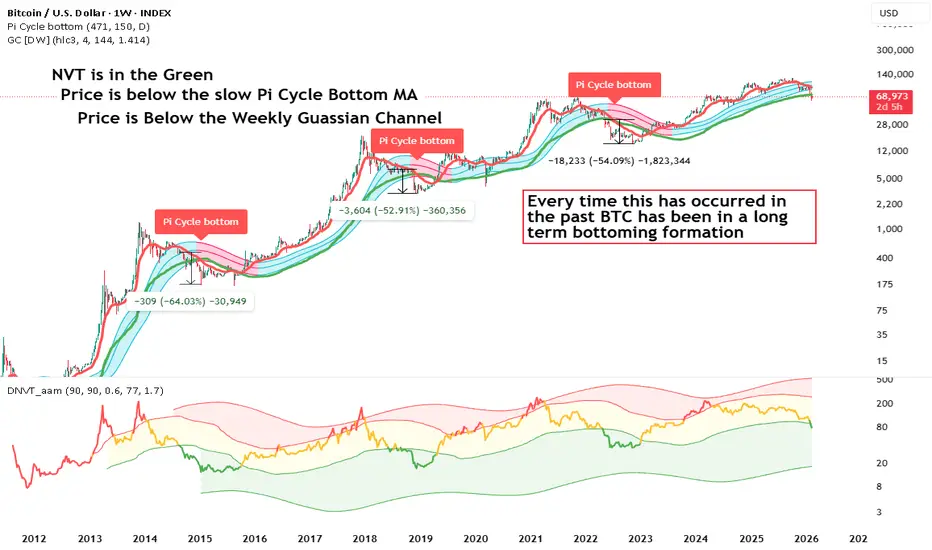
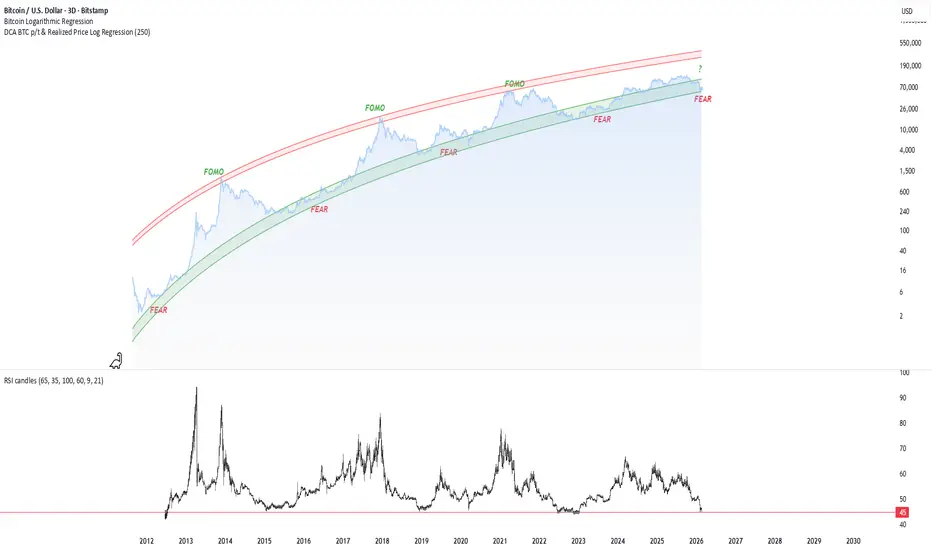
FEAR ? The Logic of the "Fear Zone" & Macro Reset
Logarithmic Regression Channel (15-Year Trend)
As seen in the chart above, Bitcoin is currently trading within the Green "FEAR" Zone of its 15-year logarithmic regression channel.
Historical Significance: Every major cycle bottom (2015, 2019, 2022) has o
See all crypto ideas
Gold next move (expecting sell)(18-02-2026)Plz Go through the analysis carefully and do trade accordingly.
Anup 'BIAS for the day (18-02-2026)
Current price- 4960
"if Price stays below 4990-95 then next target is 4940, 4900, 4850 and 4760 and above that 5020 and 5100".
-POSSIBILITY-1
Wait (as geopolitical situation are worsening )
-POSS

Gold 30Min Engaged ( Bearish Entry Detected )⚡Base : Hanzo Trading Alpha Algorithm
The algorithm calculates volatility displacement vs liquidity recovery, identifying where probability meets imbalance.
It trades only where precision, volume, and manipulation intersect —only logic.
✈️ Technical Reasons
/ Direction — SHORT / Reversal 4940 Area

GOLD - Consolidation ahead of newsFX:XAUUSD is recovering from weekly lows of 4840 and testing strong resistance at 4944, which is holding back growth ahead of the news. The market is awaiting the publication of the minutes of the January FOMC meeting
The FOMC minutes will provide clues about the timing and scale of rate cuts.

XAUUSD Long: Demand Support Signals Potential Upside To 5,000Hello traders! Here’s my technical outlook on XAUUSD (3H) based on the current chart structure. Gold was previously trading within a well-defined ascending channel, where price consistently respected both the dynamic support and resistance boundaries. This structure reflected strong buyer control an

#XAUUSD: 1500+ Intraday Trading Idea, Let's See How It GoesDear Traders,
Gold has been declining since market opening at 4950. We believe the price is likely to continue falling around $4700 which is a strong indication.
Please exercise risk management while trading gold and consider using small target sizes initially such as 300 pips before increasing th

Gold Price Analysis – Key Levels for Reversal and ContinuationThis analysis highlights critical resistance and support levels for gold prices. The Key Resistance Level at 5,436.306 may lead to price rejection or a breakout. The Support Zone at 5,108.116 is expected to hold, with potential for a bullish bounce. Critical Support at 4,888.856 is crucial for confi

THE KOG REPORT - UpdateEnd of day update from us here at KOG:
Yesterday we gave the level of 4920 which is where we wanted price to RIP and give us a long trade into the higher level to complete the pattern test and then make its way back. We managed to get the level, we managed to get the bounce, however, it was short

GOLD Price Update – Clean & Clear ExplanationGold is trading under sustained bearish pressure after breaking below a rising trendline and key intraday support levels. Price action shows a clear shift in structure from higher highs to lower highs, confirming short-term downside momentum.
The recent selloff pushed gold into a strong demand zon

Gold Under Resistance - Bearish Pressure Builds Below 5,000Hello traders! Here’s my technical outlook on XAUUSD (1H) based on the current chart structure. Gold recently experienced a strong impulsive drop from the highs, where price failed near a clear swing top and sellers stepped in aggressively. This move shifted short-term momentum bearish and drove pri

XAUUSD: Bullish Structure Holds - Buyers Target 5,110 ResistanceHello everyone, here is my breakdown of the current XAUUSD setup.
Market Analysis
XAUUSD is trading within a broader bullish environment after a strong impulsive advance earlier in the structure. This initial rally was supported by a clearly defined upward channel, confirming strong buyer control

See all futures ideas
AUDUSD Monthly CLS - Model 1 Hi friends, new range created. As always we are looking for the manipulation in to the key level around the range. Don't forget confirmation switch from manipulation phase to the distribution phase to make the setup valid. Stay patient and enter only after change in order flow. If price reaches 50%

EUR/USD - Fed Outlook & Geopolitical Calm (18.02.2026)📊 Description✅ Setup OANDA:EURUSD
EURUSD continues to respect a descending channel structure, with price reacting from the upper boundary trendline and resistance zone.
Recent price action shows:
✔ Lower highs & lower lows
✔ Rejection near trendline resistance
✔ Price trading below cloud/dynam

18.02.26 Daily ForecastPairs on Watch -
FX:EURJPY
FX:NZDUSD
FX:AUDUSD
A short overview of the instruments I am looking at for today, multi-timeframe analysis down to what I will be looking at for an entry. Enjoy!

EURUSDHello Traders! 👋
What are your thoughts on EURUSD?
The price has successfully broken above a long-term descending trendline and a major resistance zone, confirming a structural bullish shift in the higher timeframe.
After reaching the recent swing high, the pair entered a healthy corrective phase

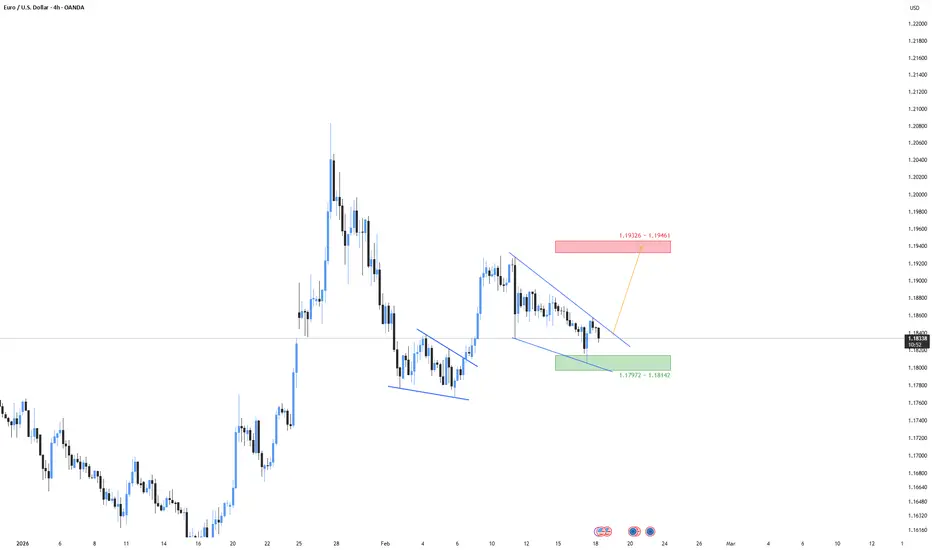
EURUSD Short: Bearish Channel Points Toward 1.1790 DemandHello traders! Here’s my technical outlook on EURUSD (2H) based on the current chart structure. EURUSD was previously trading inside a well-defined ascending channel, where price respected both dynamic support and resistance boundaries while forming consistent higher highs and higher lows. This stru

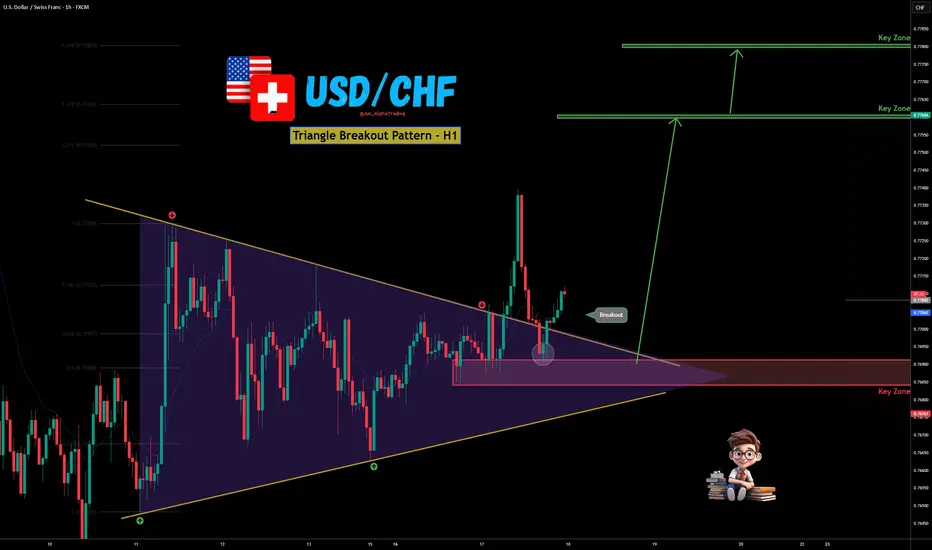
USD/CHF Triangle Breakout on H1 – Bullish Expansion Loading?📊 USD/CHF – H1 Technical Outlook
✅USD/CHF has formed a clear symmetrical triangle on the H1 timeframe, showing prolonged consolidation and price compression. After multiple rejections from descending resistance and higher lows building at support, price has now broken above the upper trendline — s
GBP/USD – The Distribution Has Already StartedOver the past sessions, I’ve been closely monitoring GBP/USD, and the recent price action suggests the market may be transitioning from bullish expansion into a distribution phase. After the impulsive rally toward the 1.38 region, continuation signals have weakened, and price is now struggling to ma

USDJPY 30Min Engaged ( Bullish Entry Detected )⚡Base : Hanzo Trading Alpha Algorithm
The algorithm calculates volatility displacement vs liquidity recovery, identifying where probability meets imbalance.
It trades only where precision, volume, and manipulation intersect —only logic.
Technical Reasons
/ Direction — LONG / Reversal 153.000 Area

EURUSD 4H: Down-Channel Compression → Wait for Acceptance
Context : Price is compressing inside a descending channel. The lower band is being defended, suggesting liquidity absorption rather than clean continuation.
Macro Tailwind : A softer USD narrative (rate-cut expectations + Fed credibility risk) can support EUR strength, but execution is strictl
EURCHF: Bulls could push price to 0.9180 in the short termEURCHF: Bulls could push price to 0.9180 in the short term
EURCHF broke out of a triangle pattern, indicating increasing bullish momentum.
0.9590 was a historical low for EURCHF, so we could see bullish momentum building around this area, which could push price back up in another bullish attempt

See all forex ideas
Trade directly on Supercharts through our supported, fully-verified, and user-reviewed brokers.


